Strong Seasonal Pattern Found in Search Data for Marketing Mix
Dec 21, 2009 Industry News, Marketing And Advertising Analytics
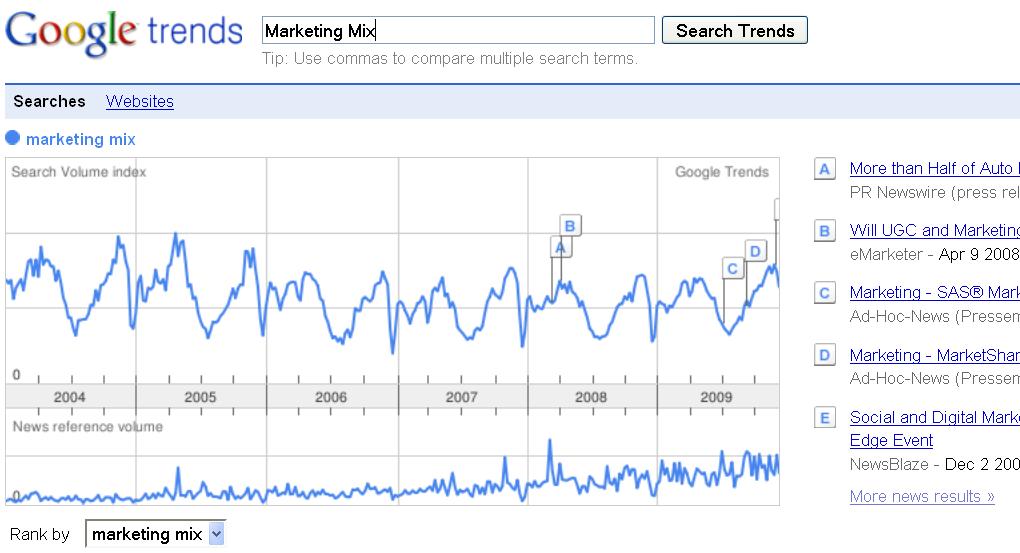
I guess it makes a kind of sense, but a search I did in Google Trends on the phrase “Marketing Mix” indicates that marketers are only interested in the topic during the colder months of the year. I guess once plans are submitted and budgets are approved, they have bigger fish to fry. Or maybe they are in the Hamptons. Take a look at the graph in the screenshot below – classic annual seasonality, right?
One of the changes I would expect to happen in the next few years, is that focus on marketing mix will become more continuous, and this graph will look more linear.
Tags: Bill Seely, Google Trends, Graph, Keyword Search Frequency, Marketing Mix, Practical Marketing Analytics, Seasonality
New Partnership Measuring Online Ad Impact on CPG Sales: IRI, Comscore, AOL, [x+1], and Dynamic Logic
Dec 21, 2009 Industry News, Marketing And Advertising Analytics, Web Analytics
A recent spate of press releases (HERE, HERE, and HERE, among others.) announced a partnership that will offer measurement of online advertising’s sales impact for consumer packaged goods companies. What does this mean to online content providers, agencies and ad networks? If there is a credible way of measuring the impact of online advertising on the sales of snacks, beverages, health and beauty aids, OTC pharmaceuticals and household products, this will unlock huge CPG money that has been held back from full adoption of online advertising because of uncertainty about its relative effectiveness compared to channels CPG companies have used for decades. Did I say “huge money”? I meant to say HUGE MONEY.
This will ultimately have a secondary effect that is good for the analytics business – it will raise the bar. CPG companies have long used analytics to plan and measure impact for their media spending, and as a result, they are data and modeling savvy. They will not blindly accept whatever someone pulls from Atlas, DoubleClick, Google Analytics, Omniture or WebTrends. The CPG paradigm is one where the cross-effects and tradeoffs between different media channels are measured and modeled, and nothing gets the big spend unless the numbers support it. This goes way beyond just throwing some tags in some ads and counting impressions, clicks and conversions. This entails starting with capture of how marketing dollars are spent, and then modeling how the spending does or does not move total sales (not just the sales from online). Things are about to get even more interesting.
Tags: [x+1], AOL, Bill Seely, Comscore, Dynamic Logic, Information Resources, IRI, Practical Marketing Analytics, press release
Interactive TV Today Cites Practical Marketing Analytics RE: the Future of iTV
Dec 11, 2009 Industry News, TV and iTV Analytics

I got some coverage in iTVT! (See the link HERE.) Rick Howe, who writes a regular column for iTVT called “The iTV Doctor is In!” ran a response from me today in his year-end wrapup. He is doing a series of columns featuring iTV industry pundits’ answers to this question:
“Dateline: December 22, 2012 – Well, we got past the Mayan “end of the world” prophecy and the world didn’t end. In point of fact, our little corner of the world–interactive television–is doing quite nicely, thank you. We have dozens of enhanced/interactive television programs airing every night in over 60 million homes; advertisers have stepped up, and are now paying a healthy premium for interactive spots; and viewers now EXPECT interactivity in their favorite shows–it’s just part of the experience.
What was the single most significant factor that led to this success?”
Anyway, it was a cool assignment, and I won’t spoil the fun by telling you my full answer here, but standards and user-oriented design are where I placed the future credit the amazing success that I hope happens. To get my full response, along with those from Arthur Orduna (CANOE’s CTO) and Ellen Dudar (FourthWall Media’s Chief Product Officer), go read the ARTICLE.
Tags: Arthur Orduna, Bill Seely, Canoe, core audience, core viewership, Ellen Dudar, Fourthwall Media, interactive experiences, Interactive Television, Interactive TV, Interactive TV Today, itvt.com, Practical Marketing Analytics, Rick Howe, TV and iTV Analytics