Listing Your Way to the Finish Line
Mar 25, 2010 Statistics, TV and iTV Analytics, Web Analytics
Draft Marketing Analysis Checklist
After reading Atul Gawande’s recent book “Checklist Manifesto”, I was thinking there should be a checklist for marketing analysis. One point that Mr. Gawande makes in his book is that highly-trained specialists shun checklists because in their minds only dummies need lists. However, a majority of surgeons, while rejecting lists for their own use, would want another surgeon to use one if operating on them. This is because they know how easy it is to forget one detail in hundreds.

In marketing analysis, there are a lot of steps and a lot of things to think about, and even a smart person might drop a stitch here or there if they are not following some kind of list. I have included a rough one I dashed off quickly, in hopes that others might offer refinements, altogether better lists, or more specific versions for types of marketing programs. Here it is, have at it!
DEFINE
• SET goals/ hypotheses for program
• SELECT metrics
• CREATE a measurement plan
EXECUTE
• EXECUTE program and measurement plan
• VALIDATE raw data
• PREPARE dataset for analysis
ANALYZE
• VISUALLY EXPLORE dataset for patterns and problems
• SUMMARIZE dataset statistics
• SCORE performance vs. goals/ support for hypotheses
• LIST likely conclusions
• IDENTIFY unexpected or surprising findings
• VALIDATE likely conclusions with numerical/statistical support
• SELECT final findings
COMMUNICATE
• REPORT findings for future activity
• REVIEW findings with user community
• CAPTURE questions &issues from user community
FOLLOW-UP
• INVESTIGATE user-identified questions & issues
• IDENTIFY impact on original findings
• REPORT findings of follow-up analysis
What do you think?
Tags: Analysis, Analytics, Atul Gawande, Check, Checklist, List, marketing, Process
Cable Moving Steadily To Advanced Advertising (DBS Has A Healthy Lead In This Race)
Feb 26, 2010 Industry News, TV and iTV Analytics

Per this story by Steve Donahue in Light Reading Cable, Canoe is setting expectations for measured, steady progress in advanced advertising via cable. Interactivity is beginning to be rolled out now, but targeting at the individual household level is 4-5 years away.
Seth Haberman of Visible World is quoted in the article as estimating that 60-70 million households will be interactive and addressable and interactive during that 4-5 year timeframe.
Between now and then, the story will be all about EBIF deployment and steady increase in the sophistication of interactive capabilities offered. EBIF households should reach upwards of 20 million households by the end of 2010. DBS operators Dish Networks and DirecTV already offer substantial interactivity in programs and advertising to 29 million households. You might be wondering what the heck EBIF is. It stands for Enhanced TV Binary Interchange Format, but really all you need to know is that it is a set of standards that will make it possible to deploy the same interactive code across all platforms that have implemented the standard. It looks like that will eventually be most Cable MSOs and IPTV providers.
What does this mean? Well, it means the long-awaited promise of TV interactivity is going to be gradually fulfilled. For programming, that means enhanced content and audience participation. For advertising, it means addressability, interactivity, and response built into ads. Finally, it means T-Commerce, which will make shopping on TV as easy and ubiquitous and easy as shopping on the web, and that will be available in programs and in ads.
The question is this: Will the internet absorb the functionality of TV (“Over-The-Top” delivery of TV programming) before TV absorbs the functionality of the Internet? We will have to wait and see. I think both will continue to exist, but will morph and mutate differently because they essentially serve different different viewer purposes and usage occasions.
The winners will be marketers and advertisers who crack the code about the right division of labor between the Internet, television, and mobile, delivering brand experiences that take advantage of the unique strengths of each available channel.
Tags: Addressability, Advanced Advertising, Cable, Cable Light Reading, DBS, EBIF, EBIF Households, Interactive Television, Interactive TV, Interactivity, Satellite TV, set-top box, Seth Haberman, T-Commerce
Opening Weekend for 2010 Winter Olympics: 117 Million US Viewers
Feb 16, 2010 Industry News, TV and iTV Analytics
Check out this article by Robert Seidman on TVbytheNumbers.com In it, he cites Nielsen ratings indicating this year’s opening ceremonies beat the Torino Olympics’ opening weekend by 5 million viewers. The average of 28.6 million viewers over the first weekend beat Torino’s first weekend by 25%.

This beats the 106.5 million viewers last weekend for the Super Bowl (see the prior post in this blog), but that was much more concentrated in time. The Super Bowl got a 68 share while the Olympics first weekend got a 26.
The Olympics also did well on the smaller screens. Three Olympics apps are currently in the top 10 on iTunes, and NBCOlympics.com traffic is 250% higher than it was for Torino. It has only been a few days, but there have already been more unique viewers for NBCOlympics.com during the Vancouver Olympics than than there were for the whole Torino Olympics.
Play With Your TV! (a shameless plug for my #1 client, Ensequence)
If you are watching the Olympics via Dish Networks or Verizon FiOS, then you can access weblike interactive content right on your TV screen alongside your favorite Olympics events. Once you tune to MSNBC, CNBC, or USA, a prompt will pop up (nothing on NBC itself, as far as I know). Clicking the “Select” button on your remote starts an interactive experience that includes Top Stories, Medal Counts, Athlete Bios, and more. Real interactive TV in the wild. Check it out!
Tags: Analytics, audience, Bill Seely, Ensequence, Inteactive Television, Interactive TV, Metrics, Nielsen, Olympics, Olympics Interactive, Practical Marketing Analytics, Robert Seidman, TV and iTV Analytics, TV Ratings, TV Viewers, Viewership
Nielsen Estimates 106.5 Million Viewers for Super Bowl XLIV (aka Beating the Pants Off Elvis)
Feb 8, 2010 Industry News, TV and iTV Analytics
In a story by David Bauder of the Associated Press, A.C. Nielsen went on record estimating that 106.5 million viewers watched Super Bowl XLIV (see at WashingtonPost.com HERE). That is the most heavily viewed event in TV history, bigger than (according to Wikipedia):
– the final episode of M*A*S*H (105.97 million viewers)
– last year’s Super Bowl (98.7 million viewers)
– the Beatles’ first appearance on The Ed Sullivan Show (73 million viewers)
– Elvis’ first appearance on The Ed Sullivan Show (60 million viewers)

To be fair to the shows of yesteryear, the total US population (and the number of households having TVs) has continued to increase since those days. There are about 305 million people currently living in the US, so about 1/3 of the entire population watched the game.
It is remarkable in our modern splinter group society that we could find something that such a huge group of people could watch together, especially when you could rule so many people out right at the starting gate: infants, toddlers, anyone in solitary confinement, anyone unconscious or too sick to care, anyone at work in a job where you can’t watch TV while you work, almost anyone who was in an airplane at the time, and most people who immigrated from countries where a “football” is something spherical.
I don’t know the full importance of this number, but it does suggest that:
1. TV has not been made irrelevant by the Internet, despite Internet entrepreneurs’ claims
2. People will still show up in giant hordes to watch a TV event en masse, if the product they are watching is enticing enough
3. Ed Sullivan really blew it by making them shoot Elvis from the waist up. The least remarkable half of him got 60 million viewers. Who knows what the full Elvis could have scored?
Tags: Analytics, AP, Associated Press, Bill Seely, David Bauder, Elvis Presley, Highest-Viewed TV Show, M*A*S*H, Metrics, Nielsen, Practical Marketing Analytics, Super Bowl, TV Viewers
Search Volume for Analytics Ramping Up Steadily – (More Fun With Google Trends)
Jan 4, 2010 Industry News, Marketing And Advertising Analytics, Statistics, TV and iTV Analytics, Web Analytics
Just for fun, I did another Google Trends search, this time on “analytics” – adding “CRM” and “ERP” as reference points. The result seems to suggest that if you are in the business software market, that you should have an analytics offering. We’ll see, but I predict that the hot growth area in business software in 2010 will be Analytics. Searches for analytics have been steadily ramping up for the last several years, and are now at a higher level than searches for the above-mentioned enterprise business software categories.
I find it very interesting that searches for “ERP” and “CRM” have been flat for so long, but REALLY interesting that the volume of “analytics” searches surpassed them in 2009.
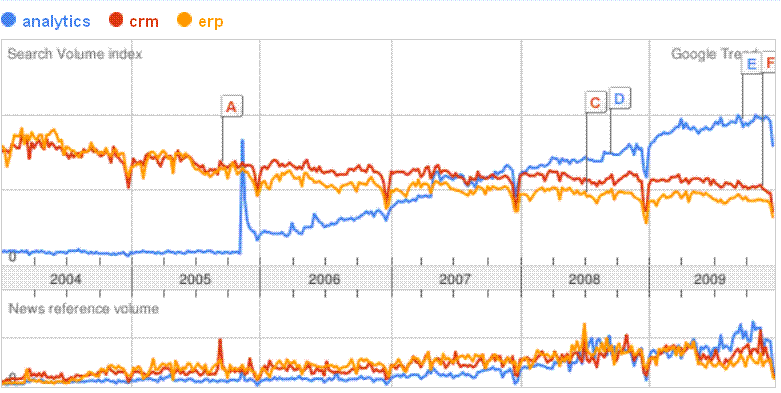
Tags: Analytics, Bill Seely, CRM, ERP, Google Trends, Graph, Keyword Search Frequency, Practical Marketing Analytics
Interactive TV Today Cites Practical Marketing Analytics RE: the Future of iTV
Dec 11, 2009 Industry News, TV and iTV Analytics

I got some coverage in iTVT! (See the link HERE.) Rick Howe, who writes a regular column for iTVT called “The iTV Doctor is In!” ran a response from me today in his year-end wrapup. He is doing a series of columns featuring iTV industry pundits’ answers to this question:
“Dateline: December 22, 2012 – Well, we got past the Mayan “end of the world” prophecy and the world didn’t end. In point of fact, our little corner of the world–interactive television–is doing quite nicely, thank you. We have dozens of enhanced/interactive television programs airing every night in over 60 million homes; advertisers have stepped up, and are now paying a healthy premium for interactive spots; and viewers now EXPECT interactivity in their favorite shows–it’s just part of the experience.
What was the single most significant factor that led to this success?”
Anyway, it was a cool assignment, and I won’t spoil the fun by telling you my full answer here, but standards and user-oriented design are where I placed the future credit the amazing success that I hope happens. To get my full response, along with those from Arthur Orduna (CANOE’s CTO) and Ellen Dudar (FourthWall Media’s Chief Product Officer), go read the ARTICLE.
Tags: Arthur Orduna, Bill Seely, Canoe, core audience, core viewership, Ellen Dudar, Fourthwall Media, interactive experiences, Interactive Television, Interactive TV, Interactive TV Today, itvt.com, Practical Marketing Analytics, Rick Howe, TV and iTV Analytics
CIMM Meeting With TV Measurement Companies set-
Nov 2, 2009 Industry News, TV and iTV Analytics
According to an article today in MEDIAWEEK (see article here), the Coalition for Innovative Media Measurement is meeting with Nielsen, Rentrak, TiVo, TRA and TNS Media Research to get feedback about their set-top box research RFP (see my last post). I would love to be in on those meetings – it would be like getting a glimpse of the next 5-10 years of media measurement. In any case, they would not be boring – especially the one with Nielsen, whose current ratings are the thing that CIMM is looking to replace with something better.
The article states, interestingly that CIMM: “… can depart from the typical RFP process of awarding a single contract and instead foster a collaborative relationship among the research and data providers to identify multiple projects that would meet the RFP”. Perhaps they, too, wonder who would respond.
Tags: CIMM, Coalition for Innovative Media Measurement, data, Kantar, MEDIAWEEK, Metrics, Nielsen, Practical Marketing Analytics, Rentrak, Seely, set-top box, TiVo, TNS Media Research, TRA
Coalition for Innovative Media Measurement – the CIMM – Gets Launched
Nov 2, 2009 Industry News, TV and iTV Analytics, Web Analytics
The Coalition for Innovative Media Measurement (the CIMM) launched their website last week (http://www.cimm-us.org). Members in the coalition consists of TV programmers, advertisers, and ad agencies. While AT&T is represented, it is their Brand Marketing and Advertising SVP who is sitting on the council.
The CIMM released two research RFPs on their site last week. The two areas for investigation:
1. Investigate the current and future potential of TV measurement via set top box data
2. Cross-platform measurement of video across Television, Internet, and Mobile
This may sound simple, but don’t let the short sentences fool you. The first one alone is loaded with gotchas that will make responders think twice. First of all, they have to be the first of the set-top box vendors willing to be completely transparent with their data and their processes. This is unlikely to be undertaken by an operator for the usual price of a research study.
Who knows? Maybe I am wrong and one of them will step up in order to get first-mover advantage in the data-vending business. Maybe AT&T will get pulled in because of their participation in the council. The reason I am skeptical is that the operators are unlikely to arm programmers with better information to use against them in negotiations around carriage fees etc. without getting a really huge concession or advantage in return. Perhaps it might make more sense for a company like TiVo to participate than it would for a cable, telco or DBS operator.
As someone who wants access to the information, I hope I am wrong and would love to be proven so. We’ll see.
Tags: AT&T, CIMM, Coalition for Innovative Media Measurement, cross-platform, data, Kantar, MEDIAWEEK, Metrics, multiplatform, Practical Marketing Analytics, Seely, set-top box, three screen viewing, video
Practical Marketing Analytics’ Bill Seely interviewed in InteractiveTV Today
Oct 16, 2009 Industry News, TV and iTV Analytics
Bill is interviewed in Rick Howe’s “Dear iTV Doctor” column published today (Friday October 16, 2009). Check it out at http://bit.ly/mLaD7.
The topic was how to apply interactive television to engage and activate a TV show’s superfans. Bill talks about the impact of tailoring the design and features of an interactive experience embedded in a TV program to the needs and interests of the hard-core fans of the program.
Rick’s column appears regularly in Tracey Swedlow’s InteractiveTV Today (ITVT) (www.itvt.com), the most widely read and trusted news source on the rapidly emerging medium of multiplatform, broadband interactive television (ITV).
Tags: Bill Seely, core audience, core viewership, interactive experience, Interactive Television, Interactive TV, Interactive TV Today, Interview, itvt.com, Practical Marketing Analytics, Rick Howe, superfans, TV and iTV Analytics
How To Maximize Viewer Participation In Your Interactive TV Applications
Sep 30, 2009 Industry News, TV and iTV Analytics
Here are several ideas to drive maximum interactive participation and duration for your interactive television application:
Idea One: Begin With the End in Mind (apologies to Stephen Covey)
What is your business objective? If you get specific about what you want viewers to do with your interactive experience, you can design to make that more likely. For example, if you want viewers to interact for a long time, that favors design that is immersive and absorbing, with lots of content and lots of features. On the other hand, if you want to get the highest possible number of viewers to participate in the experience, then an unobtrusive and streamlined experience is what you want, with very focused functionality (e.g., opt in, vote for your favorite contestant, then exit).
Idea Two: Have a Compelling Viewer Value Proposition
Once you know what you want the viewer to do, you need to design an experience that meets that objective AND gives the viewer compelling value for the time they spend interacting. A weak viewer value proposition yields weak performance vs. your business goals.
Idea Three: It All Starts With a Click (No Click = No Participation)
Viewers will likely have no advance knowledge about what a particular interactive application does (or even what iTV is), or why they should care about it, so whatever is displayed on the screen to entice/enable them to start the experience is critical. I visualize the flow of viewers into an interactive application as a huge funnel with a very tiny hole in it. You want to:
1. Make the hole at the bottom of the funnel less tiny – make the prompt visible, enticing, and self-explanatory
2. Increase the “pressure” in the funnel – present a call to action that makes it obvious and compelling why viewers should interact (communicate your viewer value proposition)
3. Fill the funnel with as many potential interactors as possible – by presenting the opportunity to start the experience to as many of viewers as possible.
Idea Three: Present Many Opportunities to Opt In
Interactive experiences with more opportunities to enter them get more viewers participation. That means:
1. Present the opportunity more frequently during a given program or ad
2. Present the opportunity in multiple contexts (triggers in programs or ads as well as listings and banners in operator interactive portals)
3. Present the opportunity at multiple times of day
Tags: audience, Bill Seely, How-To, interactive experience, Interactive Television, Interactive TV, Metrics, Optimize, Performance, Practical Marketing Analytics, set-top box, TV and iTV Analytics, viewer value proposition