Opening Weekend for 2010 Winter Olympics: 117 Million US Viewers
Feb 16, 2010 Industry News, TV and iTV Analytics
Check out this article by Robert Seidman on TVbytheNumbers.com In it, he cites Nielsen ratings indicating this year’s opening ceremonies beat the Torino Olympics’ opening weekend by 5 million viewers. The average of 28.6 million viewers over the first weekend beat Torino’s first weekend by 25%.

This beats the 106.5 million viewers last weekend for the Super Bowl (see the prior post in this blog), but that was much more concentrated in time. The Super Bowl got a 68 share while the Olympics first weekend got a 26.
The Olympics also did well on the smaller screens. Three Olympics apps are currently in the top 10 on iTunes, and NBCOlympics.com traffic is 250% higher than it was for Torino. It has only been a few days, but there have already been more unique viewers for NBCOlympics.com during the Vancouver Olympics than than there were for the whole Torino Olympics.
Play With Your TV! (a shameless plug for my #1 client, Ensequence)
If you are watching the Olympics via Dish Networks or Verizon FiOS, then you can access weblike interactive content right on your TV screen alongside your favorite Olympics events. Once you tune to MSNBC, CNBC, or USA, a prompt will pop up (nothing on NBC itself, as far as I know). Clicking the “Select” button on your remote starts an interactive experience that includes Top Stories, Medal Counts, Athlete Bios, and more. Real interactive TV in the wild. Check it out!
Tags: Analytics, audience, Bill Seely, Ensequence, Inteactive Television, Interactive TV, Metrics, Nielsen, Olympics, Olympics Interactive, Practical Marketing Analytics, Robert Seidman, TV and iTV Analytics, TV Ratings, TV Viewers, Viewership
Nielsen Estimates 106.5 Million Viewers for Super Bowl XLIV (aka Beating the Pants Off Elvis)
Feb 8, 2010 Industry News, TV and iTV Analytics
In a story by David Bauder of the Associated Press, A.C. Nielsen went on record estimating that 106.5 million viewers watched Super Bowl XLIV (see at WashingtonPost.com HERE). That is the most heavily viewed event in TV history, bigger than (according to Wikipedia):
– the final episode of M*A*S*H (105.97 million viewers)
– last year’s Super Bowl (98.7 million viewers)
– the Beatles’ first appearance on The Ed Sullivan Show (73 million viewers)
– Elvis’ first appearance on The Ed Sullivan Show (60 million viewers)

To be fair to the shows of yesteryear, the total US population (and the number of households having TVs) has continued to increase since those days. There are about 305 million people currently living in the US, so about 1/3 of the entire population watched the game.
It is remarkable in our modern splinter group society that we could find something that such a huge group of people could watch together, especially when you could rule so many people out right at the starting gate: infants, toddlers, anyone in solitary confinement, anyone unconscious or too sick to care, anyone at work in a job where you can’t watch TV while you work, almost anyone who was in an airplane at the time, and most people who immigrated from countries where a “football” is something spherical.
I don’t know the full importance of this number, but it does suggest that:
1. TV has not been made irrelevant by the Internet, despite Internet entrepreneurs’ claims
2. People will still show up in giant hordes to watch a TV event en masse, if the product they are watching is enticing enough
3. Ed Sullivan really blew it by making them shoot Elvis from the waist up. The least remarkable half of him got 60 million viewers. Who knows what the full Elvis could have scored?
Tags: Analytics, AP, Associated Press, Bill Seely, David Bauder, Elvis Presley, Highest-Viewed TV Show, M*A*S*H, Metrics, Nielsen, Practical Marketing Analytics, Super Bowl, TV Viewers
Alan Wurtzel’s Editorial in the Q3 Issue of the Journal of Advertising Research
Jan 25, 2010 Industry News, Marketing And Advertising Analytics
More good metrics reading from the JAR: After my prior posting on metrics articles in the Q4 Issue of the Journal of Advertising Research, it occurred to me that I did not mention the editorial that NBC’s Alan Wurtzel wrote in the Q3 issue…

Now. Or Never – An Urgent Call to Action for Consensus on New Media Metrics” by Alan Wurtzel, President of Research and Media Development at NBC Universal
In this editorial, Alan Wurtzel lays out what he believes is a critical juncture for measurement of new media. He sums it up this way: “You can’t sell what you can’t measure, and, unfortunately, our measurement systems are not keeping up with either technology or consumer behavior.” The problem isn’t a lack of data – the samples are getting bigger and the precision is getting greater. The problem is that technical challenges exist that make it hard to assess the validity of measurements. Without precise and transparent definition for how data are gathered and metrics are being calculated from data, Wurtzel says programmers cannot depend on the numbers as a basis for decision-making. Proprietary considerations are holding vendors back providing this level of visibility into their processes.
Wurtzel cites a case – quoted by many sources last fall – where NBCU purchased and compared viewership data for the “Heroes” finale from several different set-top box (STB) vendors. The difference between the highest and lowest measurement of the show’s ratings was 6% – which translates into $400,000 of difference in revenue. While 6% sounds low, the “Heroes” example had high enough ratings that they should have had relatively low variation in measurement, meaning that the variation in ratings for lower-rated shows would be much worse. And this is variation in purportedly directly-measured STB data, which should have had little variation at all.
According to Wurtzel, there are serious differences between different vendors that cause this variation. For example, there is no standard way to determine whether or not an STB-attached TV is on or off from the STB data stream, so every data vendor has come up with their own algorithm for deciding when the TV is on or off, and they aren’t sharing these algorithms. There are other similar “edit rules” that each vendor carefully guards. This creates differences in the measurements generated. Now, when you think of the task as not just measuring TV, but an integrated understanding of how a program works across three screens (TV, Mobile, and Internet), now you are looking at huge gaps in comparability and meaning of metrics from screen to screen.
This was written last Fall. What grew out of this thinking was the CIMM, which I have discussed in prior posts. What is likely to happen in the long run is anyone’s guess, but Alan’s article reads like a set of product requirements for the ultimate three-screen audience metrics platform, so the best outcome would be for some smart entrepreneur were to develop just such an offering. Hmmm… I’d say keep your eyes on the marketplace.
Tags: Alan Wurtzel, Bill Seely, JAR, Journal of Advertising Research, NBCU, New Media Metrics, Practical Marketing Analytics, set-top box
The December Issue of the Journal of Advertising Research (JAR) has Great Metrics Articles!
Jan 25, 2010 Industry News, Marketing And Advertising Analytics
There are a couple of useful articles this month in the Journal of Advertising Research. They are on a roll over at the JAR, driving some great discussion in the last few months about measurement of marketing, digital and otherwise. Recommended reading in this month’s issue:

“Commentary: Who Owns Metrics? Building a Bill of Rights for Online Advertisers”, by Benjamin Edelman, Harvard Business School Assistant Professor in Negotiation, Organizations & Markets
Ben Edelman, who has written on the role of deception and overcharging in online media (among other topics) is right on target here – he argues that advertisers have a right to know where and when their ads are being shown, delivered in the form of meaningful, itemized billing. He also asserts the advertisers’ ownership of the data that comes from their campaigns, and says they should (for example) be able to use data collected from their Google PPC campaigns to target campaigns on MS AdCenter or Yahoo! This is definitely a controversial area – certainly Google, along with cable and satellite TV operators, would disagree – read it and let me know what you think.
“It’s Personal: Extracting Lifestyle Indicators in Digital Television Advertising“, by George Lekakos, Assistant Professor in e-Business at the University of the Aegean, Greece.
In case you think my comment about TV distributors wanting to own audience data is irrelevant in the context of digital marketing, Lekakos lays out a scheme for using set-top box data to discover and target lifestyle segments that are then used as part of a targeting algorithm. The author lays out an approach by which TV set-top box data can be used to drive very accurate personalization and targeting of ads, but the question of whether the data belongs to the distributors, the programmers, or the advertisers is quite critical to whether this can be implemented. I’d have to say that the question is far from settled.
“Measuring Advertising Quality on Television: Deriving Meaningful Metrics from Audience Retention Data“<by Dan Zigmond, Sundar Dorai-Raj, Yannet Interian, and Igor Naverniouk
The authors explore the use of audience retention metrics captured via TV set-top boxes as a measure of ad quality. They use a “retention score” that purports to isolate the effect of ad creative on audience retention, and link it with future audience response and qualitative measures of ad quality. They assert its usefulness as a relevance measure that could be used to optimize TV ad targeting and placement. Again, we should note that the issue of data ownership needs to be dealt with if this approach is going to be applied widely.
“The Foundations of Quality (FoQ) Initiative: A Five-Part Immersion into the Quality of Online Research“, by Robert Walker, Raymond Petit, and Joel Rubinson
To address both the increasing importance of online research and questions about its validity, the FoQ Initiative has been undertaken to measure the quality of online research. The Online Research Quality Council included large advertisers, ad agencies, academic researchers, and research suppliers in the process. Among the issues they addressed: accuracy, representativeness, and replicability of results, identification and handling of questionable survey-taking behaviors, and the suspicion that small number of “heavy” online respondents are taking most online surveys.
Some of the interesting findings:
Tags: Analytics, Ben Edelman, Bill Seely, Dan Zigmond, FoQ, George Lekakos, Igor Naverniouk, JAR, Joel Rubinson, Journal of Advertising Research, Metrics, Practical Marketing Analytics, Raymond Petit, Robert Walker, Sundar Dorai-Raj, The Foundations of Quality Initiative, Yannet Interian
Facebook Dominates Social Media Searches (Yet More Fun With Google Trends)
Jan 4, 2010 Industry News, Web Analytics
Playing with tools is fun – I did another Google Trends search, this time comparing “Facebook” to “MySpace”, “YouTube” and “LinkedIn” as reference points. Wow – searches for “Facebook” have really grown amazingly fast (see the first chart, below). I wish I had bought a piece of that company 2-3 years ago.
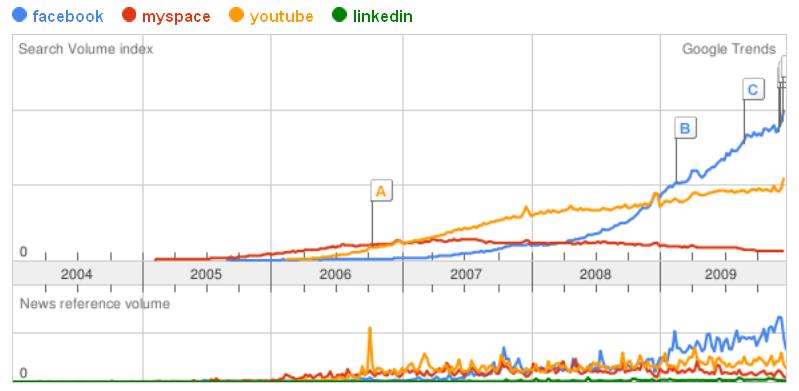
It occurred to me that there should be a corresponding trend in searches for “social networking”, relative to other online marketing activities (e.g., email, search, display advertising). Searches for “social networking” have had a huge growth rate, but the absolute volume turns out to be really small compared to “email” and “search”. I guess there is still time to get on that bandwagon. The search volume for “Facebook” crushes that for those terms, but this is made harder to interpret by the fact that these are much more likely to be searches by users, not just marketing professionals.
Tags: Bill Seely, Facebook, Google Trends, Graph, Keyword Search Frequency, Practical Marketing Analytics, Social Media
Search Volume for Analytics Ramping Up Steadily – (More Fun With Google Trends)
Jan 4, 2010 Industry News, Marketing And Advertising Analytics, Statistics, TV and iTV Analytics, Web Analytics
Just for fun, I did another Google Trends search, this time on “analytics” – adding “CRM” and “ERP” as reference points. The result seems to suggest that if you are in the business software market, that you should have an analytics offering. We’ll see, but I predict that the hot growth area in business software in 2010 will be Analytics. Searches for analytics have been steadily ramping up for the last several years, and are now at a higher level than searches for the above-mentioned enterprise business software categories.
I find it very interesting that searches for “ERP” and “CRM” have been flat for so long, but REALLY interesting that the volume of “analytics” searches surpassed them in 2009.
Tags: Analytics, Bill Seely, CRM, ERP, Google Trends, Graph, Keyword Search Frequency, Practical Marketing Analytics
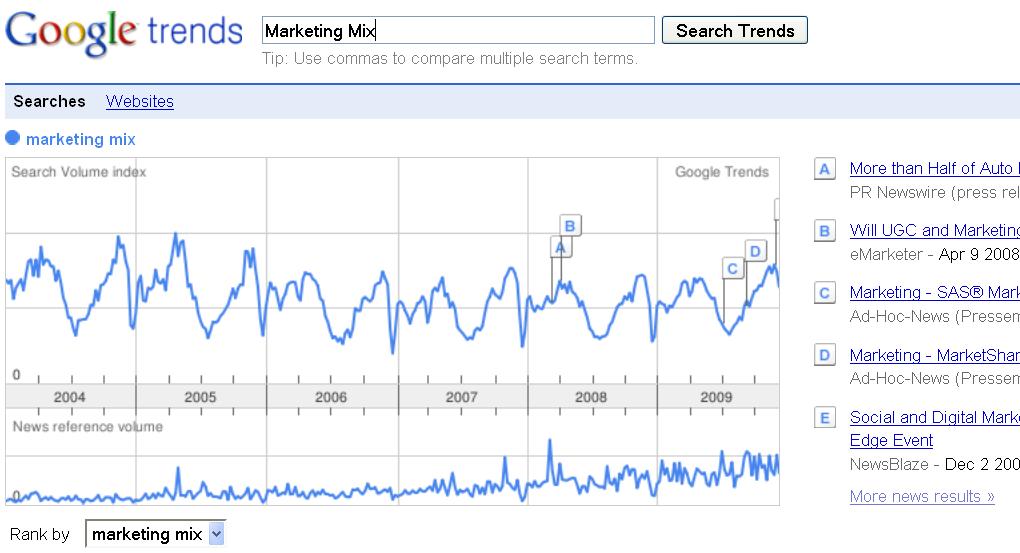
Strong Seasonal Pattern Found in Search Data for Marketing Mix
Dec 21, 2009 Industry News, Marketing And Advertising Analytics
I guess it makes a kind of sense, but a search I did in Google Trends on the phrase “Marketing Mix” indicates that marketers are only interested in the topic during the colder months of the year. I guess once plans are submitted and budgets are approved, they have bigger fish to fry. Or maybe they are in the Hamptons. Take a look at the graph in the screenshot below – classic annual seasonality, right?
One of the changes I would expect to happen in the next few years, is that focus on marketing mix will become more continuous, and this graph will look more linear.
Tags: Bill Seely, Google Trends, Graph, Keyword Search Frequency, Marketing Mix, Practical Marketing Analytics, Seasonality
New Partnership Measuring Online Ad Impact on CPG Sales: IRI, Comscore, AOL, [x+1], and Dynamic Logic
Dec 21, 2009 Industry News, Marketing And Advertising Analytics, Web Analytics
A recent spate of press releases (HERE, HERE, and HERE, among others.) announced a partnership that will offer measurement of online advertising’s sales impact for consumer packaged goods companies. What does this mean to online content providers, agencies and ad networks? If there is a credible way of measuring the impact of online advertising on the sales of snacks, beverages, health and beauty aids, OTC pharmaceuticals and household products, this will unlock huge CPG money that has been held back from full adoption of online advertising because of uncertainty about its relative effectiveness compared to channels CPG companies have used for decades. Did I say “huge money”? I meant to say HUGE MONEY.
This will ultimately have a secondary effect that is good for the analytics business – it will raise the bar. CPG companies have long used analytics to plan and measure impact for their media spending, and as a result, they are data and modeling savvy. They will not blindly accept whatever someone pulls from Atlas, DoubleClick, Google Analytics, Omniture or WebTrends. The CPG paradigm is one where the cross-effects and tradeoffs between different media channels are measured and modeled, and nothing gets the big spend unless the numbers support it. This goes way beyond just throwing some tags in some ads and counting impressions, clicks and conversions. This entails starting with capture of how marketing dollars are spent, and then modeling how the spending does or does not move total sales (not just the sales from online). Things are about to get even more interesting.
Tags: [x+1], AOL, Bill Seely, Comscore, Dynamic Logic, Information Resources, IRI, Practical Marketing Analytics, press release
Interactive TV Today Cites Practical Marketing Analytics RE: the Future of iTV
Dec 11, 2009 Industry News, TV and iTV Analytics

I got some coverage in iTVT! (See the link HERE.) Rick Howe, who writes a regular column for iTVT called “The iTV Doctor is In!” ran a response from me today in his year-end wrapup. He is doing a series of columns featuring iTV industry pundits’ answers to this question:
“Dateline: December 22, 2012 – Well, we got past the Mayan “end of the world” prophecy and the world didn’t end. In point of fact, our little corner of the world–interactive television–is doing quite nicely, thank you. We have dozens of enhanced/interactive television programs airing every night in over 60 million homes; advertisers have stepped up, and are now paying a healthy premium for interactive spots; and viewers now EXPECT interactivity in their favorite shows–it’s just part of the experience.
What was the single most significant factor that led to this success?”
Anyway, it was a cool assignment, and I won’t spoil the fun by telling you my full answer here, but standards and user-oriented design are where I placed the future credit the amazing success that I hope happens. To get my full response, along with those from Arthur Orduna (CANOE’s CTO) and Ellen Dudar (FourthWall Media’s Chief Product Officer), go read the ARTICLE.
Tags: Arthur Orduna, Bill Seely, Canoe, core audience, core viewership, Ellen Dudar, Fourthwall Media, interactive experiences, Interactive Television, Interactive TV, Interactive TV Today, itvt.com, Practical Marketing Analytics, Rick Howe, TV and iTV Analytics
CIMM Meeting With TV Measurement Companies set-
Nov 2, 2009 Industry News, TV and iTV Analytics
According to an article today in MEDIAWEEK (see article here), the Coalition for Innovative Media Measurement is meeting with Nielsen, Rentrak, TiVo, TRA and TNS Media Research to get feedback about their set-top box research RFP (see my last post). I would love to be in on those meetings – it would be like getting a glimpse of the next 5-10 years of media measurement. In any case, they would not be boring – especially the one with Nielsen, whose current ratings are the thing that CIMM is looking to replace with something better.
The article states, interestingly that CIMM: “… can depart from the typical RFP process of awarding a single contract and instead foster a collaborative relationship among the research and data providers to identify multiple projects that would meet the RFP”. Perhaps they, too, wonder who would respond.
Tags: CIMM, Coalition for Innovative Media Measurement, data, Kantar, MEDIAWEEK, Metrics, Nielsen, Practical Marketing Analytics, Rentrak, Seely, set-top box, TiVo, TNS Media Research, TRA