Google Trends and the 2010 Elections – Can You Use Search Data to Predict Elections?
Nov 4, 2010 Industry News, Search Analytics
I am interested in the use of search data to predict and forecast real-world events. One example I have mentioned here before is the Google Flu Project, which uses the volume of searches for flu-related topics to actually do early detection and tracking of flu outbreaks.
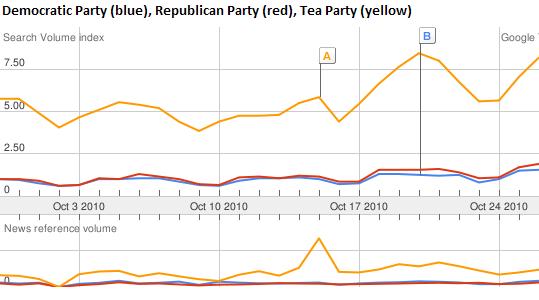
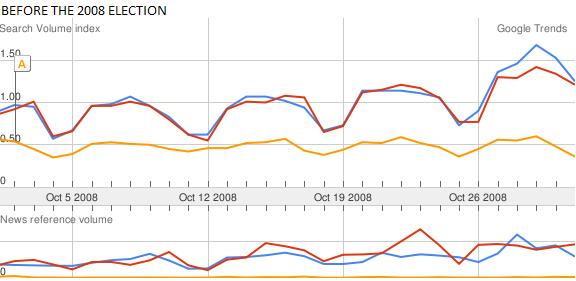
I thought it might be interesting to see whether or not there was anything I could tell about likely election outcomes from the volume of searches related to the Republican and Democratic parties. I did a comparison of the search volumes for “Republican Party”, “Democratic Party”, and “Tea Party” during October 2010, and looked at the same data for October 2008 (leading up to the last presidential election). Interestingly. the major party with the lead in October searches came out the winner in both cases. The Tea Party search volume needs to be explained though – if the voting followed the search volume completely, then we’d all be speaking Tea Party-ese now.
October 2010: More searches for “Republican Party” (the red line) than for “Democratic Party” (the blue line)
October 2008: More searches for “Democratic Party” (the blue line) than for “Republican Party” (the red line)
I KNOW, ELECTIONS ARE ACTUALLY MORE COMPLICATED THAN THAT
One glaring weakness of my half-hour exploration into election forecasting is that it is hard to imagine prospective voters searching mainly using party names. It is far more likely that candidates’ names and words relating to major issues would be the search terms of interest for predicting election outcomes. That, however, is more work than I would do for a blog post. I encourage anyone reading this to take up the gauntlet and pursue the more detailed view. Let me know how that comes out!
WHAT ABOUT THE YELLOW LINE?
Another factor that would have to be dealt with in building a real live election forecasting tool using search data would be the curiosity factor. People don’t just use search engines to research their voting interests – they also use them to satisfy their curiosity about topics (and political parties) that are currently in the public eye. That complicates the forecasting problem a bit. How can you tell idle curiosity from actual voting interest? I will have to mull that over…
Tags: Election Forecasts, elections, Google, Google Trends, politics, search, search data and elections
The Digital Nervous System
Aug 20, 2010 Industry News, Marketing And Advertising Analytics, Statistics, Web Analytics
The web can function like a giant extension of the human nervous system. Like a spider at the center of a giant global web, you can collect and observe streams of data coming from all over the digital expanse: searches, tweets, forums, blogs, newspaper and magazine sites, press releases, Facebook and LinkedIn. Each time someone looks for or mentions your company or your product you are alerted, and you can choose in that moment to respond to it, ignore it or wait until you have more information.
Does this sound like anything you are doing now? Someone should be doing this for your company, because marketing has increasingly become an ongoing series of conversations (whether you participate in the conversation or not).
EXPERIMENT: DETECTING INSTANT RESPONSE TO MEDIA WITH THE INTERNET
There are several national TV shows that frequently have book authors as guests (the Daily Show, The Colbert Report, The Today Show, Good Morning America). The next time you find yourself in front of one of these shows when an author is on plugging their book, try the following experiment (this will work best with a show with a national audience):
1. Fire up your laptop and go to amazon.com
2. Search in the Books category for the title of the book the author is plugging on the show you are watching
3. Click to the Amazon page for that book.
4. Scroll down past the synopsis and the reviews to the section labelled Product Details. It should look something like this:

The number I have circled is the book’s current sales rank on Amazon.
5. Every few minutes while the author is on the show and for a while after that (until you bore of this experiment), hit function key f5 to refresh the page and watch what happens to the book’s sales ranking.
The rank should get better – in real time – as you are sitting there. I have done this several times when my brother-in-law has done TV appearances to promote his books, and it is amazing. Once he was on Oprah Winfrey and we saw the sales rank improve precipitously from 20-something into the top 10 while he was being interviewed.
Now imagine all the other analogous information streams there are available on the internet. If you could get the monitoring automated, just think of how quickly you will know exactly what the world thinks of your new site, your new ad campaign, your new product. Just think of what you’d be missing by NOT knowing.
EXTRA CREDIT EXPERIMENT #1 – THE TWITTER BUMP
In between rank checks you should do check in on Twitter searches for the author’s name and the book’s name. These should also pop during the author’s TV appearance.
EXTRA CREDIT EXPERIMENT #2 – THE GOOGLE BUMP
After a day or so you should go to Google Trends and see what happened to searches for the author’s name and the book’s name. These should’ve spiked on the day the author did the TV appearance. Google Trends doesn’t provide much flexibility about getting more granular (in time) data in a more real-time way, and it looks like the beta for Google Insights for Search has a latency of a couple of days.
GOOGLE EPIDEMIOLOGY – WHO KNEW THEY COULD DO THAT?
Take a look at the Google Flutrends project (http://www.google.org/flutrends) and you can see what an amazingly useful datasource this would be with access to the full detail in realtime. It turns out that counting Google searches for flu information is a quicker detector of flu epidemics than CDC reports are.
I believe it would be just as accurate in detecting other kinds of contagion sweeping through the world: fads, emerging trends, scares, rumors, accidents, disasters – this is the kind of information that businesses need to know when it involves their products, their brands, or their markets.
Tags: Amazon Book Rankings, Amazon.com, Digital Nervous System, Google Search Insights, Google Trends, Listening programs, Real-time trend detection, Social Media Montoring, Twitter
Math Marketing: Excellent White Paper by Dimitri Maex
Mar 15, 2010 Industry News, Marketing And Advertising Analytics, Optimization, Statistics, Web Analytics
Dimitri Maex is the Managing Director Marketing Effectiveness at Ogilvy & Mather, and the author of a fantastic white paper that is posted HERE on the WPP website . What is so great about it is that it presents exactly what most companies need to know in order to get started in harnessing the full power of quantitative marketing methods, in a package that only takes about 15 minutes to read.

He starts with the history of quantitative marketing, gives a sense of the place of “math marketing” in the current business landscape, describes the types vendors with which a company can ally, and the wraps up with how a company should organize and hire to around the new skills and challenges peculiar to the coming era of quantitatively-driven marketing.
Some nits:
I don’t like the sound of the name “math marketing”. It’s just that the math doesn’t do any marketing – people still make the decisions and integrate the insights into their work, they just use data-based metrics and statistical techniques to assist them in getting a coherent picture of what is working and what isn’t, and formulating what might work in the future. It is probably also a terrible way to brand something you are selling to execs who mostly sucked at and avoided math in school. It’s like calling it “eat your vegetables marketing”.
The section on vendors is far from exhaustive. He leaves out SEM/SEO agencies in particular, and provides only the massive brand names in most of the categories he is describing. I guess Maex works for an ad agency – so he’s not responsible for selling you on his competition – but I’d look elsewhere for a buyer’s guide.
Whatever, he is right on the money about the current state of affairs and where most companies need to go.
He wraps with a couple of lists: Seven Steps to Increased Accountability, and Seven Steps to Increased Accountability to Transformational Consumer Insights.
This is a great document for business folk who want to understand the big picture of marketing analytics and quantitative marketing techniques, and want to understand how to manage them to best effect.
Tags: Data Mining, Dimitri Maex, Doubleclick, econometric models, Google Trends, Marketing Analytics, marketing mix models, Math Marketing, Microsoft, Ogilvy & Mather, quantitative marketing
Facebook Dominates Social Media Searches (Yet More Fun With Google Trends)
Jan 4, 2010 Industry News, Web Analytics
Playing with tools is fun – I did another Google Trends search, this time comparing “Facebook” to “MySpace”, “YouTube” and “LinkedIn” as reference points. Wow – searches for “Facebook” have really grown amazingly fast (see the first chart, below). I wish I had bought a piece of that company 2-3 years ago.
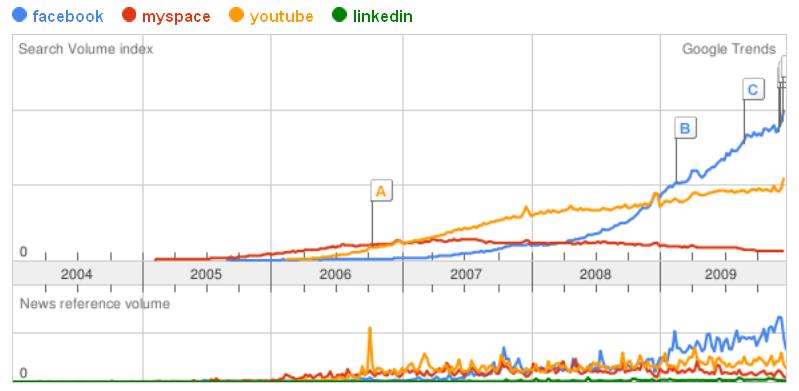
It occurred to me that there should be a corresponding trend in searches for “social networking”, relative to other online marketing activities (e.g., email, search, display advertising). Searches for “social networking” have had a huge growth rate, but the absolute volume turns out to be really small compared to “email” and “search”. I guess there is still time to get on that bandwagon. The search volume for “Facebook” crushes that for those terms, but this is made harder to interpret by the fact that these are much more likely to be searches by users, not just marketing professionals.
Tags: Bill Seely, Facebook, Google Trends, Graph, Keyword Search Frequency, Practical Marketing Analytics, Social Media
Search Volume for Analytics Ramping Up Steadily – (More Fun With Google Trends)
Jan 4, 2010 Industry News, Marketing And Advertising Analytics, Statistics, TV and iTV Analytics, Web Analytics
Just for fun, I did another Google Trends search, this time on “analytics” – adding “CRM” and “ERP” as reference points. The result seems to suggest that if you are in the business software market, that you should have an analytics offering. We’ll see, but I predict that the hot growth area in business software in 2010 will be Analytics. Searches for analytics have been steadily ramping up for the last several years, and are now at a higher level than searches for the above-mentioned enterprise business software categories.
I find it very interesting that searches for “ERP” and “CRM” have been flat for so long, but REALLY interesting that the volume of “analytics” searches surpassed them in 2009.
Tags: Analytics, Bill Seely, CRM, ERP, Google Trends, Graph, Keyword Search Frequency, Practical Marketing Analytics
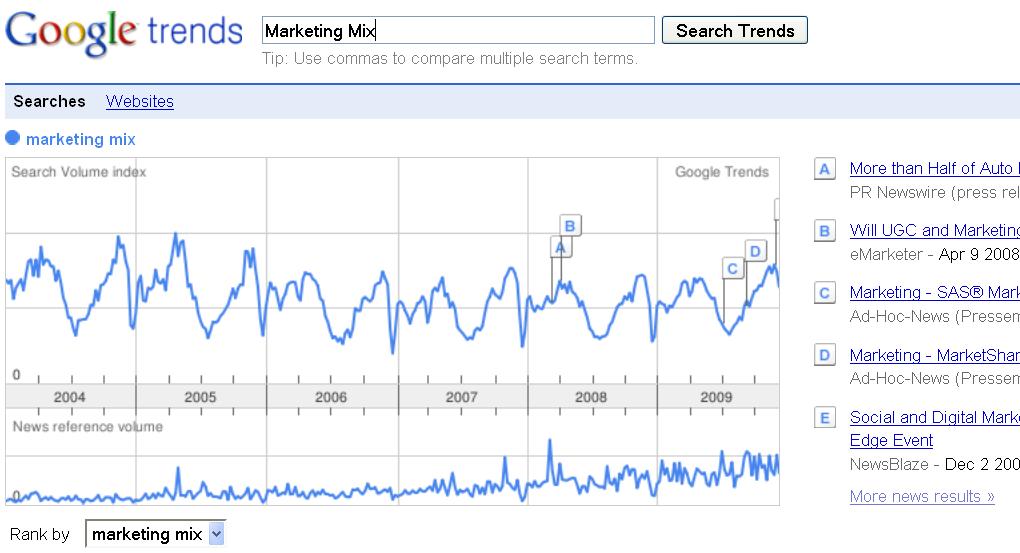
Strong Seasonal Pattern Found in Search Data for Marketing Mix
Dec 21, 2009 Industry News, Marketing And Advertising Analytics
I guess it makes a kind of sense, but a search I did in Google Trends on the phrase “Marketing Mix” indicates that marketers are only interested in the topic during the colder months of the year. I guess once plans are submitted and budgets are approved, they have bigger fish to fry. Or maybe they are in the Hamptons. Take a look at the graph in the screenshot below – classic annual seasonality, right?
One of the changes I would expect to happen in the next few years, is that focus on marketing mix will become more continuous, and this graph will look more linear.
Tags: Bill Seely, Google Trends, Graph, Keyword Search Frequency, Marketing Mix, Practical Marketing Analytics, Seasonality