Don’t Confuse Your Funnel With Reality
May 28, 2014 Industry News, Marketing, Marketing And Advertising Analytics, Optimization, Search Analytics, Web Analytics
Models are supposed to make it easier to see useful patterns, but if you devote enough time to using them you can forget you are looking at a simplified view of reality and not reality itself. The marketing funnel is a great example of how this can happen.

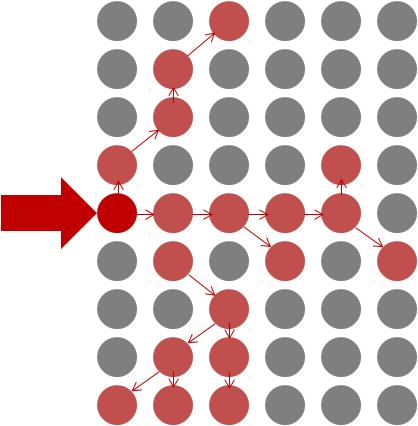
When you are trying get a holistic view of your marketing plan, it is often helpful to segment the audience according to where they are on the path from never having heard of your brand to the end state of buying your product. It can make things clearer. Let’s say you have done some analysis of the buying process for your product and you have found that people move through it like this:
Let’s further say your numbers say that the conversion rates for a given month look like this:
The numbers indicate that once someone is researching your product you have a really good chance of making them a customer. Depending on your cost per acquisition and the value of your product, you’d probably want to step up your efforts to drive them to your site.
Would that still be your conclusion if you knew that:
The list of complicating factors could go on and on. The point is, you are looking at a model. Don’t forget there is a particularly complicated reality behind any marketing model: the mind of the buyer.
Meekerology: Trending the Trender
Jan 2, 2014 Industry News, Marketing And Advertising Analytics, Web Analytics, Web Business Trends
“The future ain’t what it used to be.” – Yogi Berra
Every year about this time a barrage of “Top N” lists is unleashed, predicting what will be happening in the coming year. I think of the genre as a listicle wrapped in an article. Check it out – look on Google right now. A lot of them will be junk, and many are more or less copies of one another (sometimes attributed, sometimes not).
By contrast, the presentations of Mary Meeker (of Kleiner Perkins Caufield & Byers) are a treasure trove of recent digital history. I Googled them and found decks going back to 2005.
Looking back at how her top trends have evolved over the last eight years paints a quite a picture. The top item in 2005 was broadband penetration. The story morphs from adoption to portable always-on access by 2010, and by 2013 ecommerce – once dismissed as snake oil – is now the engine of global innovation and economic growth.
Take a look at how the first three bullet points in Mary Meeker’s decks have shifted from 2005 to 2010 to now:
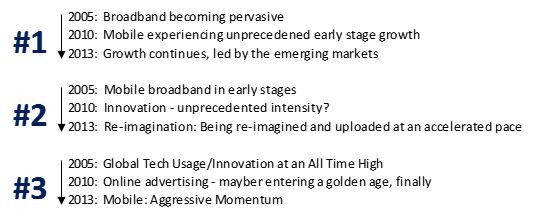
How Items 1,2 and 3 on Mary Meeker’s list have changed since 2005
From a device perspective, the focus has shifted from PCs and laptops, to smartphones, to tablets, and next to wearables and the “Internet of Things”.
The devices, though, are taking a back seat to the integration of the technology into our lives, and an ongoing explosion of ways to take advantage of its capabilities in all aspects of our lives.
Mobile changes ranks over the years, and goes from “early-stages” in 2005, to “unprecedented early-stage growth” in 2010, to “Aggressive Momentum”. The Meeker lists also show consistently ramping pace of innovation and “re-imagination”(which, to me, is a nicer word for disruption).
That’s Nice. But What Does This All Mean For Digital Marketing?
My informal Meekerological forecast says this:
1. Mobile is going to continue to increase in importance
If you believe Mary, then your number 1 takeaway should be that if you aren’t playing in mobile and tablets, then you are missing out on a massive trend. People aren’t just checking email and Facebook on mobile devices – they are now doing some serious e-commerce there.
2. Content marketing HAS to happen if you want to keep your constituency alive
We cannot all be content parasites. People get bored with me-too links to the seven original articles on the Web this week. UGC (user-generated content) is okay for some things – like finding out what people like ourselves think about a new movie or book or product, but day to day, people are starved for researched, curated, creative, non-amateur content. This is a golden opportunity to connect with your audience.
3. Big Data: Look into it, learn it, use it (but PLEASE stop calling it that)
Don’t search for latent patterns (e.g., people with curly red hair who enjoy Scrabble are your most efficient audience), which are usually subtle in impact, if you are not already exploiting commonsense first-order data effects.
4. Social, social, social
Increased mobile access seems to be manifested in sharing more things in more ways on more occasions. If that is where your customers are, then shouldn’t you, your messages, and your content be there too? Now that Congress is thinking about taxing advertising, other ways of spreading the word will be even more attractive.
5. Master the channels that your customers use
Do not tweet or build a Facebook app because you think it is the way to be modern. Do these things because that is where your customers are spending their time and you can connect with them and influence them particularly well in those channels.
The Future of SEO: Not Provided
Sep 30, 2013 Industry News, Optimization, Search Analytics, Web Analytics

The Future of SEO is Not Provided
So, let’s see if I have mapped out this ecosystem correctly.
1. People come to Google.com to do searches, because they perceive that Google’s search results are the best.
2. SEM marketers bid on impressions of certain words and phrases relating to their product, and the winners’ ads show up at the top of the page before the natural (unpaid) results. Some more paid ads appear on the right-hand side of the page.
3. Part of each paid ad’s success in the auction for impressions has to do with how well the content on the landing page for the ad’s link corresponds to the terms the person was searching for.
4. The unbiased “natural” search results appearing after the paid ads also have a kind of competition going on behind them. A search algorithm has to decide which order to present them in, and does so based on a large number of factors.
5. Firms in the SEO space have built a business out of using an understanding of natural search result ranking algorithms to help redesign sites to be as discoverable as possible through natural search.
SEO is based, in large measure, on data about who arrives on which pages after searching for various terms – this group could be analyzed, segmented and treated differently based on what they expressed an interest in via search. Remove the information about which terms an individual is searching for, and you are now stuck analyzing natural traffic as a giant undifferentiated blob of traffic.
Google just rendered this data invisible for natural search clicks. Who does that benefit?
1. Google likes SEM, because that is where their paychecks come from.
2. SEM and SEO are interrelated. If your site is employing good SEO practices, your SEM is more efficient. That means you make more money and probably allocate more over time to SEM. This is good for Google, but in an indirect way.
3. SEO is harder without granular keyword data that can be used to tailor site content to user needs (or advertiser goals). This is not good for SEO providers.
4. If sites in general begin to be less searchable as a result of Google’s cessation of critical SEO data, then users’ experience of search could possibly decline. I guess that depends on whether you believe the activities are, taken in the aggregate, improving search results or degrading them. SEO improves the search experience to the extent that it tries to discern the searcher’s intent and deliver what they are looking for. SEO degrades the search experience if it is trying to trick a user into visiting a page that is not what they are searching for.
– Apparently Google either believes:
a. SEO hurts the experience more than it improves it, or
b. Some degradation in the user experience is OK in the service of making more money while being able to claim a privacy/security benefit.
In any case, the deed is done.
Perhaps the folks at Google is looking to take the business of SEO for themselves? I mean no one knows the rules better than the people who make up the rules, right?
Tags: encrypted search, Google
How Not To Do An A/B Test
Oct 12, 2012 Industry News, Marketing And Advertising Analytics, Optimization, Search Analytics, Statistics, Web Analytics

A Homemade Mess
There are a large number of ways to make a hot mess out of an A/B test. Here are five:
1. Don’t Measure Conversions
“We don’t have time to set up conversion tracking. Let’s just decide based on click rate.”
This is a terrible idea. Clicking and converting are two very different things, and click rates are often not correlated with conversion rates. For example, I click on pictures of Ferraris, because I like to look at Ferraris, but you can ask all my friends – I have never bought a Ferrari. I have bought a Mazda, a Toyota, a Datsun and a Ford Maverick. You can show me a Ferrari if all you want is clicks, but show me something I might actually buy if you want conversions.
2. Don’t Do Any Test Size Calculations
Ten minutes of work could tell you that you won’t have enough data to read your test even if you ran it for two years. Are you sure you can’t afford some time to do a Google search for “A/B Test Calculator” and plug some numbers into a form?
I’ll save you even more time, use this one: ABBA
3. Stick With Your Test Size Calculations No Matter What Happens
The test size calculations you did were based on some assumptions: confidence level, the magnitude of the difference you wanted to be able to detect, and the expected performance of the baseline or control. After you’ve run the test for a while you can begin to see where reality and your assumptions have parted ways. What should you do? Most people do repeated significance calculations and quit when they are satisfied with the significance. If you do this, you’ve spent too much time and opportunity cost on your test. You could have quit sooner, had you known about Anscombe’s Stopping Rule, which uses an approach called regret minimization, and you would actually end up with more conversions.
Check it out: A Bayesian Approach to A/B Testing
4. Don’t Think About Gating
What is gating?
Let’s say you have two different versions of a page: Version A and Version B. Let’s say your plan is to rotate them randomly. Let’s say your site and your content are such that most people come to the site repeatedly, say two to six times per week. If you are rotating Version A and Version B completely at random, then most of your users are going to see a blended treatment. This will reduce the effects of your test. To fix this, you want to make the version a person sees “sticky’ so one group sees only Version A during the test and the other group sees only Version B. That way each group sees a consistent treatment and you will see more of an effect (assuming the differences between A and B are substantial enough).
This is called “gating” and is done by randomly assigning new visitors (people with no gating in their cookie) to Version A or B, and then storing that in their cookie so that the next time they will see the same version.
5. Conclude That Your A/B Testing Result is Actually Optimal
An A/B test picks one “best” version for everyone. But isn’t it possible that there are some people in the audience who’d respond best to Version A and others who’d respond best to Version B? For that, you’d need to be able to collect lots of data about what kinds of users respond to the different options, and then you’d need a way to target the two versions at the audiences they work best with. Fortunately such tools exist.
Check out the toolset I work with every day at [X+1]: [X+1] Home Page
Go With The Flow (Diagram) – Gettin’ Sankey With It
Jan 13, 2012 Industry News, Marketing And Advertising Analytics, Web Analytics
If you are looking for a great way to visualize the way traffic is flowing through a website, try a Sankey diagram, which is a kind of flow diagram where the width of the flow arrows is shown proportionally to the flow quantity. It is a very quickly understood way of communicating what can be complex information.

Very Simple Sankey Diagram
Like many other people, I had my first taste of Sankey in Edward Tufte’s “The Visual Display of Quantitative Information”, which featured a diagram by Charles Joseph Minard that illustrated Napoleon’s disastrous march to (and from) Moscow. Arrows on the map of Europe showed the Napoleon’s route, while the width of the arrows indicated the (disastrously shrinking) size of his Army.
If you want to try this technique out on your website, read more about Google Analytics’ flow visualization here. It is a dynamic, Sankey-like diagram that you can navigate to get an intuitive visual grasp of how traffic is moving through a site.
Measurement is No Substitute for Thinking BIG
Oct 7, 2010 Marketing And Advertising Analytics, Statistics, Web Analytics
Whether you are doing SEO for a site or running paid search for one, running display ad campaigns or social media, everyone is trying to measure the same thing – they are trying to find evidence that what they are doing is worth the money and time it costs.
There is a point of view (not necessarily mine) that says: If you have to do a complicated analysis to see the effect of a marketing initiative, then it wasn’t very effective. There is some truth there. It is easier, statistically speaking, to measure a BIG marketing impact than it is to measure a small one.

Reality is complicated, though. If you are engaged in “filling the funnel”, you want to know how how that translates – in the long run – into actual sales. However, unless you can wait until there is data for the whole decision and purchase process to make any decisions about how to manage the campaign and the channel, then you will have to go with measuring some intermediate impact.
It is almost a certainty that enough other things will happen to impact sales in the time between your funnel-filling campaign and the sales it ultimately leads to. Enough things to muddy the waters about how much of of your success (or lack of it) came from the lagged effect of your funnel-filling efforts. Unless the effect is big.
This is not to say that measurement is not necessary for early-stage marketing activities, but to say that you have to apply some common sense to your measurement problems, and one bit of marketing common sense is this: think BIG. Now think BIGGER. You should always be aiming to have a big effect – you won’t always succeed in a huge way, but it should not be for lack of trying.
Here’s an idea: Every time you create a campaign, a marketing tactic, an ad, you should at least TRY to do some creative thinking that taps into one or more sources of disproportionate (on the BIG side) response. What well-defined and targetable group would have a peculiar affiinity with your message and your product? What would make them want to know more NOW, click NOW, buy NOW?
What does that have to do with measurement? Two things:
1. Even if your BIG idea doesn’t work, you are actually testing a hypoethesis and so you have gotten just a little smarter.
2. Your goal is to produce impact so BIG that you don’t even really need to measure it to know that the effort was ROI-positive. (But you are measuring it anyway, so you can explain why the next one needs to have a bigger budget!) And – falling short of a really BIG goal will get you to positive business results more often than falling short of modest goals.
Tags: Andre the Giant, BIG, Campaign Measurement, Marketing Analytics, Online Advertising, Scale of Marketing Effects, SEO, Social Media, Statistics
The “Death of Marketing” Has Been Announced Prematurely
Aug 23, 2010 Industry News, Marketing And Advertising Analytics, Social Media, Web Analytics
Has there been a fundamental change in how people think about and buy goods and services? Is old-school marketing dead?
According to the recently-minted orthodoxy of social media, marketing is being transformed, and we are moving from the Age of Push to the Era of the Conversation. The Don Drapers of the world, they say, will now have to play the new way, find new jobs or become hobos. Participation in a conversation is voluntary, per the new theory, meaning marketers can’t unilaterally control conversations and so now must learn to communicate differently with the people in the marketplace.
WHAT HASN’T CHANGED
Marketing Has Always Been A Conversation – Marketers Just Haven’t Recognized It Until Now
There is an important truth here – much of the conversation about brands and products is intra-customer, and doesn’t involve the marketer at all. This has always been the case, but it just has not been as observable until it started happening online.
Audiences Have Always Been Able to Walk Away
Audiences have always asserted more control over the “conversation” than marketing models have admitted. People have been fast-forwarding and channel-surfing through television ads since they figured out which remote control buttons to use. Since the very birth of mass media, admen and their clients have been solving and re-solving the problem of how to entice an audience to listen to their stories instead of wandering off to grab something from the refrigerator.
Propaganda Still Works
Working against this is has always been the fact that (as psychological experiments have shown) repeated messages have an influence on peoples’ perceptions and behavior even if they are skeptical or not paying full attention, and even if they are aware they are being ‘sold’.
WHAT HAS CHANGED
The Emergence of Social Media
Thanks to social media lowering the bar for what constitutes a relationship, people are regularly engaging in communication with a wider circle of casual or low-involvement contacts.
Conversations are Observable and Trackable
We can find out what people are saying about brands and our products (at least when they happen in online social media). These conversations can assert a great deal of influence on buying behavior.
Advertisers and Marketers can Participate in the Conversation
Marketers can, when they decide it is to their advantage, participate in these conversations and assert some influence on the the agenda and the messages
Advertisers and Marketers can START the Conversation
Marketers can initiate conversations, and they can provide the platform or venue for these conversations to take place. However, the the attempt can backfire. Conversations can and will change locations if a community gets the sense that there is excessive censoring or propagandizing.
SO?
So, things have changed, but not that much. People still need to buy things, they still need to decide what to buy and where to buy it. It’s just that now, people increasingly use social media (among other channels) to get information about products and services they are considering. Social networks have always been influential, but now they are pervasive, instantaneous, and measureable. So you shouldn’t ignore social media, you should listen to and participate in it. That’s all.
Tags: Death of Marketing, Don Draper, Facebook, hobo, LinkedIn, listening, Listening programs, marketing, Marketing as Conversation, Social Media, Twitter
The Digital Nervous System
Aug 20, 2010 Industry News, Marketing And Advertising Analytics, Statistics, Web Analytics
The web can function like a giant extension of the human nervous system. Like a spider at the center of a giant global web, you can collect and observe streams of data coming from all over the digital expanse: searches, tweets, forums, blogs, newspaper and magazine sites, press releases, Facebook and LinkedIn. Each time someone looks for or mentions your company or your product you are alerted, and you can choose in that moment to respond to it, ignore it or wait until you have more information.
Does this sound like anything you are doing now? Someone should be doing this for your company, because marketing has increasingly become an ongoing series of conversations (whether you participate in the conversation or not).
EXPERIMENT: DETECTING INSTANT RESPONSE TO MEDIA WITH THE INTERNET
There are several national TV shows that frequently have book authors as guests (the Daily Show, The Colbert Report, The Today Show, Good Morning America). The next time you find yourself in front of one of these shows when an author is on plugging their book, try the following experiment (this will work best with a show with a national audience):
1. Fire up your laptop and go to amazon.com
2. Search in the Books category for the title of the book the author is plugging on the show you are watching
3. Click to the Amazon page for that book.
4. Scroll down past the synopsis and the reviews to the section labelled Product Details. It should look something like this:

The number I have circled is the book’s current sales rank on Amazon.
5. Every few minutes while the author is on the show and for a while after that (until you bore of this experiment), hit function key f5 to refresh the page and watch what happens to the book’s sales ranking.
The rank should get better – in real time – as you are sitting there. I have done this several times when my brother-in-law has done TV appearances to promote his books, and it is amazing. Once he was on Oprah Winfrey and we saw the sales rank improve precipitously from 20-something into the top 10 while he was being interviewed.
Now imagine all the other analogous information streams there are available on the internet. If you could get the monitoring automated, just think of how quickly you will know exactly what the world thinks of your new site, your new ad campaign, your new product. Just think of what you’d be missing by NOT knowing.
EXTRA CREDIT EXPERIMENT #1 – THE TWITTER BUMP
In between rank checks you should do check in on Twitter searches for the author’s name and the book’s name. These should also pop during the author’s TV appearance.
EXTRA CREDIT EXPERIMENT #2 – THE GOOGLE BUMP
After a day or so you should go to Google Trends and see what happened to searches for the author’s name and the book’s name. These should’ve spiked on the day the author did the TV appearance. Google Trends doesn’t provide much flexibility about getting more granular (in time) data in a more real-time way, and it looks like the beta for Google Insights for Search has a latency of a couple of days.
GOOGLE EPIDEMIOLOGY – WHO KNEW THEY COULD DO THAT?
Take a look at the Google Flutrends project (http://www.google.org/flutrends) and you can see what an amazingly useful datasource this would be with access to the full detail in realtime. It turns out that counting Google searches for flu information is a quicker detector of flu epidemics than CDC reports are.
I believe it would be just as accurate in detecting other kinds of contagion sweeping through the world: fads, emerging trends, scares, rumors, accidents, disasters – this is the kind of information that businesses need to know when it involves their products, their brands, or their markets.
Tags: Amazon Book Rankings, Amazon.com, Digital Nervous System, Google Search Insights, Google Trends, Listening programs, Real-time trend detection, Social Media Montoring, Twitter
Classic GI=GO Equation Holds True for Web Analytics
Aug 20, 2010 Statistics, Web Analytics
Garbage In = Garbage Out. People who spend their working hours analyzing numbers generally come to this realization. It is true for modeling, it is true for forecasting, and it is completely true when it comes to website analytics.

The chain of events looks something like this:
1. Someone visits a website integrated with a web analytics platform like Google Analytics, Webtrends or Omniture.
2. A web page visitor either navigates to a tracked page or performs a tracked action.
3. A script is executed in the browser, sending data to the analytics platform.
4. The data is added to the datastore.
5. The data is summarized and analyzed.
Problems arise when you assume that steps 1 through 4 are happening correctly, and you move right on to looking at reports and data that come out of the process. Oddly, most site developers I have met who are instrumenting a site for web analytics consider their job done and successful if tags fire when they are expected to. They don’t look at the data as it is passed with the tags and they don’t look and see what made it into the web analytics platform’s datastore. Anything you don’t check in software development is frequently going to be wrong. If your data is wrong, then all your analysis of it will be just as wrong as the data. Again, there’s the classic equation describing this relationship:
Garbage In = Garbage Out
How do you prevent your data from being garbage? QA and debug the data, that’s how.
Before you use information coming from a web analytics solution, you should (or someone should) do these two tests:
1. Web Analytics Data Test Number One: Is the data being passed correctly?
Use a header tool of some kind to see what tags are being invoked and what kind of data they are passing to the web analytics platform. I use WASP. It shows you what kind of tag is fired when you click on navigation and site functions, and then it lists the data values the tag passes. The test is this:
Step 1: Navigate to every page in the site. A pageview should be generated for every pageview you generate and it should have the correct page name passed with it. Implementation of this is usually OK for standard HTML sites, but is error-prone for Flash sites.
Step 2: Click every function you are tracking as an action or event. See that an action or event is generated for each one you click, and that it is firing a tag that classifies it correctly – as an event, not a page view, and that the name and category that are assigned to the action are what they should be.
(Steps 3-n): Anything else you have tagged for measurement, like ad placements for an ad server, should also be clicked systematically to see that everything that is supposed to be captured about ad impressions is actually captured and passed when the tag is fired.
2. Web Analytics Data Test Number Two: Is the data making it into the database(s) correctly?
Set up your full site in staging so it will have a recognizable hostname that you can filter by in your reporting tool. Tell everyone else not to play with the version in staging for a while.
Step 1: Navigate to every page in the site in a systematic order. Do this several times. Make sure you keep track of how many times each page is viewed.
Step 2: Click every function you are tracking as an action or event. Do this several times. Make sure you keep track of how many times each action is done.
(Steps 3a-3n): Anything else you have tagged for measurement, like ad placements for an ad server, should also be clicked systematically – count the impressions and count the clicks.
Step 4: Click through every funnel you have set up, several times, all the way to the goal. If you have goals like time on site or number of pages viewed, make sure you stay long enough and look at enough pages to meet these goals.
If there are required pages in your funnels, make sure you pass through them. Again keep updating the tallies of page views and actions as you do all this.
Step 5: Wait until the data is likely to be available for reporting. Latency varies by platform. Pull reports, filtering for your hostname. You should see that the numbers of page views, actions, ad impressions, ad clicks, goals/conversions, and funnel stages matches what you did in steps 1-3. If they do not, you probably either have:
a. a tagging problem (wrong tag, misimplemented tag, redundant tags, etc.)
b. a setup problem (e.g. definitions for goals/conversions, funnels)
c. other users muddying up your data by hitting the site in staging while you are testing.
d. a more exotic and difficult problem
If this all sounds like a pain in the hindquarters, compare it to the pain of realizing that you have been reporting erroneous numbers and making business decisions based on them for months or years. Believe me, they could be so far off that you’d have been better off guessing or making numbers up. Do not trust what you cannot verify with test results, or you will have much pain and sadness in your future.
Tags: Data Validation, Debugging, Debugging Web Analytics Data, Google Analytics, Omniture, Web Analytics, Webtrends
Listing Your Way to the Finish Line
Mar 25, 2010 Statistics, TV and iTV Analytics, Web Analytics
Draft Marketing Analysis Checklist
After reading Atul Gawande’s recent book “Checklist Manifesto”, I was thinking there should be a checklist for marketing analysis. One point that Mr. Gawande makes in his book is that highly-trained specialists shun checklists because in their minds only dummies need lists. However, a majority of surgeons, while rejecting lists for their own use, would want another surgeon to use one if operating on them. This is because they know how easy it is to forget one detail in hundreds.

In marketing analysis, there are a lot of steps and a lot of things to think about, and even a smart person might drop a stitch here or there if they are not following some kind of list. I have included a rough one I dashed off quickly, in hopes that others might offer refinements, altogether better lists, or more specific versions for types of marketing programs. Here it is, have at it!
DEFINE
• SET goals/ hypotheses for program
• SELECT metrics
• CREATE a measurement plan
EXECUTE
• EXECUTE program and measurement plan
• VALIDATE raw data
• PREPARE dataset for analysis
ANALYZE
• VISUALLY EXPLORE dataset for patterns and problems
• SUMMARIZE dataset statistics
• SCORE performance vs. goals/ support for hypotheses
• LIST likely conclusions
• IDENTIFY unexpected or surprising findings
• VALIDATE likely conclusions with numerical/statistical support
• SELECT final findings
COMMUNICATE
• REPORT findings for future activity
• REVIEW findings with user community
• CAPTURE questions &issues from user community
FOLLOW-UP
• INVESTIGATE user-identified questions & issues
• IDENTIFY impact on original findings
• REPORT findings of follow-up analysis
What do you think?
Tags: Analysis, Analytics, Atul Gawande, Check, Checklist, List, marketing, Process