Recent Articles
Search Volume for Analytics Ramping Up Steadily – (More Fun With Google Trends)
Jan 4, 2010 Industry News, Marketing And Advertising Analytics, Statistics, TV and iTV Analytics, Web Analytics 2 Comments
Just for fun, I did another Google Trends search, this time on “analytics” – adding “CRM” and “ERP” as reference points. The result seems to suggest that if you are in the business software market, that you should have an analytics offering. We’ll see, but I predict that the hot growth area in business software in 2010 will be Analytics. Searches for analytics have been steadily ramping up for the last several years, and are now at a higher level than searches for the above-mentioned enterprise business software categories.
I find it very interesting that searches for “ERP” and “CRM” have been flat for so long, but REALLY interesting that the volume of “analytics” searches surpassed them in 2009.
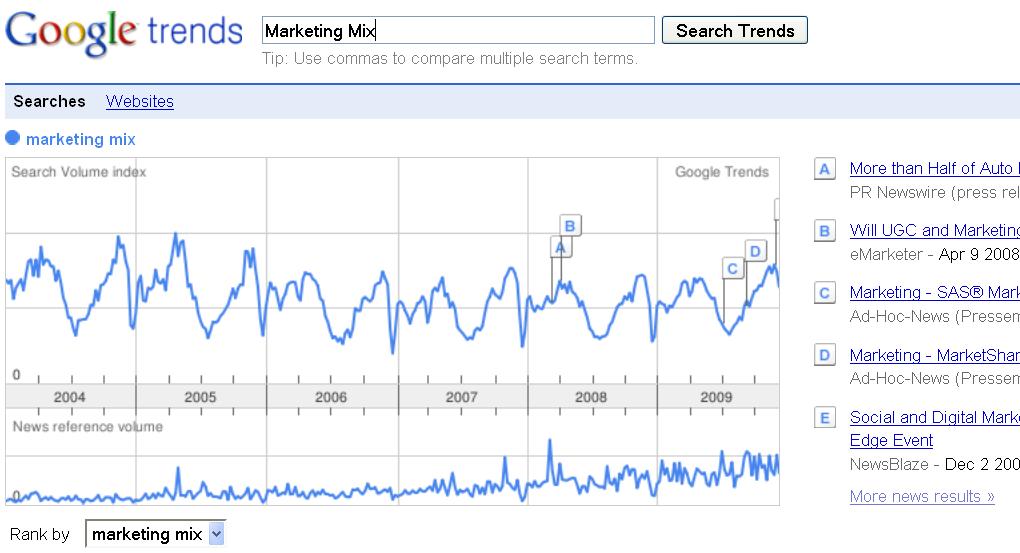
Strong Seasonal Pattern Found in Search Data for Marketing Mix
Dec 21, 2009 Industry News, Marketing And Advertising Analytics 6 Comments
I guess it makes a kind of sense, but a search I did in Google Trends on the phrase “Marketing Mix” indicates that marketers are only interested in the topic during the colder months of the year. I guess once plans are submitted and budgets are approved, they have bigger fish to fry. Or maybe they are in the Hamptons. Take a look at the graph in the screenshot below – classic annual seasonality, right?
One of the changes I would expect to happen in the next few years, is that focus on marketing mix will become more continuous, and this graph will look more linear.
New Partnership Measuring Online Ad Impact on CPG Sales: IRI, Comscore, AOL, [x+1], and Dynamic Logic
Dec 21, 2009 Industry News, Marketing And Advertising Analytics, Web Analytics 4 Comments
A recent spate of press releases (HERE, HERE, and HERE, among others.) announced a partnership that will offer measurement of online advertising’s sales impact for consumer packaged goods companies. What does this mean to online content providers, agencies and ad networks? If there is a credible way of measuring the impact of online advertising on the sales of snacks, beverages, health and beauty aids, OTC pharmaceuticals and household products, this will unlock huge CPG money that has been held back from full adoption of online advertising because of uncertainty about its relative effectiveness compared to channels CPG companies have used for decades. Did I say “huge money”? I meant to say HUGE MONEY.
This will ultimately have a secondary effect that is good for the analytics business – it will raise the bar. CPG companies have long used analytics to plan and measure impact for their media spending, and as a result, they are data and modeling savvy. They will not blindly accept whatever someone pulls from Atlas, DoubleClick, Google Analytics, Omniture or WebTrends. The CPG paradigm is one where the cross-effects and tradeoffs between different media channels are measured and modeled, and nothing gets the big spend unless the numbers support it. This goes way beyond just throwing some tags in some ads and counting impressions, clicks and conversions. This entails starting with capture of how marketing dollars are spent, and then modeling how the spending does or does not move total sales (not just the sales from online). Things are about to get even more interesting.
Interactive TV Today Cites Practical Marketing Analytics RE: the Future of iTV
Dec 11, 2009 Industry News, TV and iTV Analytics Leave a comment

I got some coverage in iTVT! (See the link HERE.) Rick Howe, who writes a regular column for iTVT called “The iTV Doctor is In!” ran a response from me today in his year-end wrapup. He is doing a series of columns featuring iTV industry pundits’ answers to this question:
“Dateline: December 22, 2012 – Well, we got past the Mayan “end of the world” prophecy and the world didn’t end. In point of fact, our little corner of the world–interactive television–is doing quite nicely, thank you. We have dozens of enhanced/interactive television programs airing every night in over 60 million homes; advertisers have stepped up, and are now paying a healthy premium for interactive spots; and viewers now EXPECT interactivity in their favorite shows–it’s just part of the experience.
What was the single most significant factor that led to this success?”
Anyway, it was a cool assignment, and I won’t spoil the fun by telling you my full answer here, but standards and user-oriented design are where I placed the future credit the amazing success that I hope happens. To get my full response, along with those from Arthur Orduna (CANOE’s CTO) and Ellen Dudar (FourthWall Media’s Chief Product Officer), go read the ARTICLE.
CIMM Meeting With TV Measurement Companies set-
Nov 2, 2009 Industry News, TV and iTV Analytics Leave a comment
According to an article today in MEDIAWEEK (see article here), the Coalition for Innovative Media Measurement is meeting with Nielsen, Rentrak, TiVo, TRA and TNS Media Research to get feedback about their set-top box research RFP (see my last post). I would love to be in on those meetings – it would be like getting a glimpse of the next 5-10 years of media measurement. In any case, they would not be boring – especially the one with Nielsen, whose current ratings are the thing that CIMM is looking to replace with something better.
The article states, interestingly that CIMM: “… can depart from the typical RFP process of awarding a single contract and instead foster a collaborative relationship among the research and data providers to identify multiple projects that would meet the RFP”. Perhaps they, too, wonder who would respond.
Coalition for Innovative Media Measurement – the CIMM – Gets Launched
Nov 2, 2009 Industry News, TV and iTV Analytics, Web Analytics 2 Comments
The Coalition for Innovative Media Measurement (the CIMM) launched their website last week (http://www.cimm-us.org). Members in the coalition consists of TV programmers, advertisers, and ad agencies. While AT&T is represented, it is their Brand Marketing and Advertising SVP who is sitting on the council.
The CIMM released two research RFPs on their site last week. The two areas for investigation:
1. Investigate the current and future potential of TV measurement via set top box data
2. Cross-platform measurement of video across Television, Internet, and Mobile
This may sound simple, but don’t let the short sentences fool you. The first one alone is loaded with gotchas that will make responders think twice. First of all, they have to be the first of the set-top box vendors willing to be completely transparent with their data and their processes. This is unlikely to be undertaken by an operator for the usual price of a research study.
Who knows? Maybe I am wrong and one of them will step up in order to get first-mover advantage in the data-vending business. Maybe AT&T will get pulled in because of their participation in the council. The reason I am skeptical is that the operators are unlikely to arm programmers with better information to use against them in negotiations around carriage fees etc. without getting a really huge concession or advantage in return. Perhaps it might make more sense for a company like TiVo to participate than it would for a cable, telco or DBS operator.
As someone who wants access to the information, I hope I am wrong and would love to be proven so. We’ll see.
Forrester Publishes Evaluation of Interactive Attribution Vendors: ClearSaleing, Visual IQ, And Atlas Lead, With [x+1] And Coremetrics Close Behind
Oct 21, 2009 Industry News, Web Analytics 13 Comments
I was just looking at the summary of the new Forrester report comparing interactive attribution vendors. My old friends at [x+1] are in the mix, even stacked up against players like Atlas, ClearSaleing, Visual IQ and CoreMetrics – despite the fact that attribution is not mainly what they do. They do it because it needs to be done well in order for them to deliver on their core competency, which is using industry-leading optimization of performance for online media and websites. Attribution is critical to optimizing media and site performance because you need an objective function (a numeric “score”) to optimize or even improve: attribution is how you keep score. Attribution is the process whereby credit for a conversion (a goal action, like a sale, subscription, or lead) is allocated among the many marketing activities and actors selling that product or service.
Historically, 100% of the credit for a sale has been attributed to the last online marketing “touch” before a purchase was made, in more or less this way:
1. All touches (impressions, clicks, conversions) needed to be tracked in the same system to be “attributable”
2. When a goal action occurred, the database was searched for the most recent impression with a click. If one is found, then it got attributed “credit” for the goal action. This is what is sometimes referred to as a “clickthrough conversion”.
3. If the whole attribution window (the time frame for which impressions are considered eligible for attribution) is searched and no click is found, then the most recent impression is found, and assigned (usually partial) credit for the conversion. This is sometimes referred to as a “view-through conversion”.
The new paradigm in attribution, represented by the offerings of the firms reviewed in the referenced Forrester paper, involves the effort to model, understand, and optimize the sequences of marketing activities that touch a prospective customer. Each of these “touches” is seen to have potential influence on the ultimate outcome (conversion vs. non-conversion), and the solutions here are ways of assigning a value to the contribution of each interaction. Some approaches to doing this are built upon models of the buying process, others are more brute force. Some vendors offer this as an approach for marketing mix allocation, others are more focused on banner, search, and site optimization.
If all this sounds fun and interesting to you, then you must be in analytics. Otherwise, the takeaway for you will just be this: better ROI (and better ROI measurement) from online marketing activities.
Practical Marketing Analytics’ Bill Seely interviewed in InteractiveTV Today
Oct 16, 2009 Industry News, TV and iTV Analytics 2 Comments
Bill is interviewed in Rick Howe’s “Dear iTV Doctor” column published today (Friday October 16, 2009). Check it out at http://bit.ly/mLaD7.
The topic was how to apply interactive television to engage and activate a TV show’s superfans. Bill talks about the impact of tailoring the design and features of an interactive experience embedded in a TV program to the needs and interests of the hard-core fans of the program.
Rick’s column appears regularly in Tracey Swedlow’s InteractiveTV Today (ITVT) (www.itvt.com), the most widely read and trusted news source on the rapidly emerging medium of multiplatform, broadband interactive television (ITV).
How To Maximize Viewer Participation In Your Interactive TV Applications
Sep 30, 2009 Industry News, TV and iTV Analytics Leave a comment
Here are several ideas to drive maximum interactive participation and duration for your interactive television application:
Idea One: Begin With the End in Mind (apologies to Stephen Covey)
What is your business objective? If you get specific about what you want viewers to do with your interactive experience, you can design to make that more likely. For example, if you want viewers to interact for a long time, that favors design that is immersive and absorbing, with lots of content and lots of features. On the other hand, if you want to get the highest possible number of viewers to participate in the experience, then an unobtrusive and streamlined experience is what you want, with very focused functionality (e.g., opt in, vote for your favorite contestant, then exit).
Idea Two: Have a Compelling Viewer Value Proposition
Once you know what you want the viewer to do, you need to design an experience that meets that objective AND gives the viewer compelling value for the time they spend interacting. A weak viewer value proposition yields weak performance vs. your business goals.
Idea Three: It All Starts With a Click (No Click = No Participation)
Viewers will likely have no advance knowledge about what a particular interactive application does (or even what iTV is), or why they should care about it, so whatever is displayed on the screen to entice/enable them to start the experience is critical. I visualize the flow of viewers into an interactive application as a huge funnel with a very tiny hole in it. You want to:
1. Make the hole at the bottom of the funnel less tiny – make the prompt visible, enticing, and self-explanatory
2. Increase the “pressure” in the funnel – present a call to action that makes it obvious and compelling why viewers should interact (communicate your viewer value proposition)
3. Fill the funnel with as many potential interactors as possible – by presenting the opportunity to start the experience to as many of viewers as possible.
Idea Three: Present Many Opportunities to Opt In
Interactive experiences with more opportunities to enter them get more viewers participation. That means:
1. Present the opportunity more frequently during a given program or ad
2. Present the opportunity in multiple contexts (triggers in programs or ads as well as listings and banners in operator interactive portals)
3. Present the opportunity at multiple times of day
Statistics: the New Plastics? – Steve Lohr/NY Times
Aug 31, 2009 Industry News, Statistics 1 Comment
Can you “make” yourself a statistician or do you have to be a bit of an oddball to begin with?
On August 5, 2009, the Technology section of the New York Times ran an article headlined: “For Today’s Graduate, Just One Word: Statistics ” In the article, author Steve Lohr cited interviews and research to declare Statistics to be the glamor career of the near future. I have been a practitioner of marketing analytics and modeling since the 1980s, and I have mixed feelings about this news: the smug sense that I was right all along about the future of business is tempered by my equally strong desire for my competition to remain sparse and disorganized.
Citing The Graduate in an article plugging a career in statistics is more than a little weird. The quoted screen conversation was meant to underscore the vapidity of a career choice based solely on what might make one a lot of money. “Plastics” was supposed to sound ridiculous:
Mr. McGuire: I want to say one word to you. Just one word.
Benjamin: Yes, sir.
Mr. McGuire: Are you listening?
Benjamin: Yes, I am.
Mr. McGuire: Plastics.
Benjamin: Just how do you mean that, sir?
Our values as a society have changed enough since that scene ran in theaters that the exchange might now read less like a siren song for emerging sellouts, and more like sincere advice about a great career opportunity. No matter – statistics is not easy to fake an interest in. I doubt that those who might flock into a statistics course because it was a “hot” field would stay with it long enough to get a degree much less stomach it long enough to make a pot of money.
Perhaps those in the business of training statisticians will reap a windfall over the next few years if a flood of newbies rushed headlong into the field on the promise of high-paying careers. Be that as it may, I have seen too many square pegs suffer in fruitless attempts to enter this particular round hole to believe that many could “will” themselves to master statistics and analytics. Being a “quant” has a lot more to do with your innate cognitive style than your desire for a certain salary.
There is no question that business is increasingly awash in floods of data that are being under-understood and under-leveraged, and that the skills are in short supply required to extract useful meaning and patterns from data to guide decision-making and strategy.