Models are supposed to make it easier to see useful patterns, but if you devote enough time to using them you can forget you are looking at a simplified view of reality and not reality itself. The marketing funnel is a great example of how this can happen.
When you are trying get a holistic view of your marketing plan, it is often helpful to segment the audience according to where they are on the path from never having heard of your brand to the end state of buying your product. It can make things clearer. Let’s say you have done some analysis of the buying process for your product and you have found that people move through it like this:
unexposed -> aware -> researching -> buying
Let’s further say your numbers say that the conversion rates for a given month look like this:
0.02% go from unaware -> aware (top 2 box on awareness survey)
0.5% go from aware -> researching (landing on site)
6.0% go from researching-> buying (completing a purchase)
The numbers indicate that once someone is researching your product you have a really good chance of making them a customer. Depending on your cost per acquisition and the value of your product, you’d probably want to step up your efforts to drive them to your site.
Would that still be your conclusion if you knew that:
While you measured your conversion numbers, one affiliate was driving 50% of your sales, and their buyers were intermingled with the rest of your audience?
You measured your conversion numbers just after your CEO’s TED talk went viral?
Word of mouth was driving more people to your site than your marketing?
A photo of a major celebrity using your product was published on HuffPo last week?
The list of complicating factors could go on and on. The point is, you are looking at a model. Don’t forget there is a particularly complicated reality behind any marketing model: the mind of the buyer.
The future of your brand – whether your marketing is online, offline, DR, branding, whatever – the survival of it depends on one key thing.
It is not big data or better metrics. It is not futuristic ad formats. It is not social media.
It is resisting the temptation to mislead people to make money. In other words, not lying.
Marketing and Lying: Not The Same Thing
The Ad Business press has been recommending something like this, but using the word “authenticity”. This sounds too much like Stephen Colbert’s “truthiness”, or like George Burns when he said, “Sincerity – if you can fake that, you’ve got it made.”
The fact of the matter is that, while the absolute truth is not determinable in any way that satisfies philosophers, sane people know when they are lying. That is why they work so hard at legitimizing their lies, substituting the idea of the legally permissible for the facts as they know them to be. In marketing, that ultimately results in: bad customer experiences, consumer cynicism, dissatisfied customers, jaded employees, and bad long-term business results. Lying is a short-term ploy to boost sales that ultimately kills sales by debasing your brand.
What alternatives are there to misleading offers, irrelevant images, and fast-talking copy?
How about:
1. What you could do to make your product better.
2. What you could do to make your customer experience better.
3. What you could do make your value proposition unbeatable.
4. What you could do to build customer loyalty.
“The future ain’t what it used to be.” – Yogi Berra
Every year about this time a barrage of “Top N” lists is unleashed, predicting what will be happening in the coming year. I think of the genre as a listicle wrapped in an article. Check it out – look on Google right now. A lot of them will be junk, and many are more or less copies of one another (sometimes attributed, sometimes not).
By contrast, the presentations of Mary Meeker (of Kleiner Perkins Caufield & Byers) are a treasure trove of recent digital history. I Googled them and found decks going back to 2005.
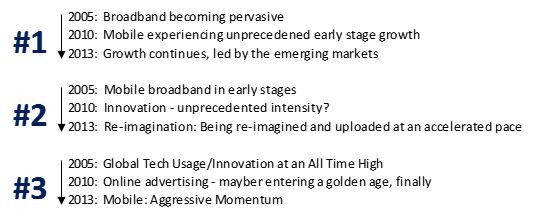
Looking back at how her top trends have evolved over the last eight years paints a quite a picture. The top item in 2005 was broadband penetration. The story morphs from adoption to portable always-on access by 2010, and by 2013 ecommerce – once dismissed as snake oil – is now the engine of global innovation and economic growth.
Take a look at how the first three bullet points in Mary Meeker’s decks have shifted from 2005 to 2010 to now:
How Items 1,2 and 3 on Mary Meeker’s list have changed since 2005
From a device perspective, the focus has shifted from PCs and laptops, to smartphones, to tablets, and next to wearables and the “Internet of Things”.
The devices, though, are taking a back seat to the integration of the technology into our lives, and an ongoing explosion of ways to take advantage of its capabilities in all aspects of our lives.
Mobile changes ranks over the years, and goes from “early-stages” in 2005, to “unprecedented early-stage growth” in 2010, to “Aggressive Momentum”. The Meeker lists also show consistently ramping pace of innovation and “re-imagination”(which, to me, is a nicer word for disruption).
That’s Nice. But What Does This All Mean For Digital Marketing?
My informal Meekerological forecast says this: 1. Mobile is going to continue to increase in importance
If you believe Mary, then your number 1 takeaway should be that if you aren’t playing in mobile and tablets, then you are missing out on a massive trend. People aren’t just checking email and Facebook on mobile devices – they are now doing some serious e-commerce there.
2. Content marketing HAS to happen if you want to keep your constituency alive
We cannot all be content parasites. People get bored with me-too links to the seven original articles on the Web this week. UGC (user-generated content) is okay for some things – like finding out what people like ourselves think about a new movie or book or product, but day to day, people are starved for researched, curated, creative, non-amateur content. This is a golden opportunity to connect with your audience.
3. Big Data: Look into it, learn it, use it (but PLEASE stop calling it that)
Don’t search for latent patterns (e.g., people with curly red hair who enjoy Scrabble are your most efficient audience), which are usually subtle in impact, if you are not already exploiting commonsense first-order data effects.
4. Social, social, social
Increased mobile access seems to be manifested in sharing more things in more ways on more occasions. If that is where your customers are, then shouldn’t you, your messages, and your content be there too? Now that Congress is thinking about taxing advertising, other ways of spreading the word will be even more attractive.
5. Master the channels that your customers use
Do not tweet or build a Facebook app because you think it is the way to be modern. Do these things because that is where your customers are spending their time and you can connect with them and influence them particularly well in those channels.
So, let’s see if I have mapped out this ecosystem correctly.
1. People come to Google.com to do searches, because they perceive that Google’s search results are the best.
2. SEM marketers bid on impressions of certain words and phrases relating to their product, and the winners’ ads show up at the top of the page before the natural (unpaid) results. Some more paid ads appear on the right-hand side of the page.
3. Part of each paid ad’s success in the auction for impressions has to do with how well the content on the landing page for the ad’s link corresponds to the terms the person was searching for.
4. The unbiased “natural” search results appearing after the paid ads also have a kind of competition going on behind them. A search algorithm has to decide which order to present them in, and does so based on a large number of factors.
5. Firms in the SEO space have built a business out of using an understanding of natural search result ranking algorithms to help redesign sites to be as discoverable as possible through natural search.
SEO is based, in large measure, on data about who arrives on which pages after searching for various terms – this group could be analyzed, segmented and treated differently based on what they expressed an interest in via search. Remove the information about which terms an individual is searching for, and you are now stuck analyzing natural traffic as a giant undifferentiated blob of traffic.
Google just rendered this data invisible for natural search clicks. Who does that benefit?
1. Google likes SEM, because that is where their paychecks come from.
2. SEM and SEO are interrelated. If your site is employing good SEO practices, your SEM is more efficient. That means you make more money and probably allocate more over time to SEM. This is good for Google, but in an indirect way.
3. SEO is harder without granular keyword data that can be used to tailor site content to user needs (or advertiser goals). This is not good for SEO providers.
4. If sites in general begin to be less searchable as a result of Google’s cessation of critical SEO data, then users’ experience of search could possibly decline. I guess that depends on whether you believe the activities are, taken in the aggregate, improving search results or degrading them. SEO improves the search experience to the extent that it tries to discern the searcher’s intent and deliver what they are looking for. SEO degrades the search experience if it is trying to trick a user into visiting a page that is not what they are searching for.
– Apparently Google either believes:
a. SEO hurts the experience more than it improves it, or
b. Some degradation in the user experience is OK in the service of making more money while being able to claim a privacy/security benefit.
In any case, the deed is done.
Perhaps the folks at Google is looking to take the business of SEO for themselves? I mean no one knows the rules better than the people who make up the rules, right?
The word “optimization” can be used to refer to a mathematical technique for selecting the best combination of controllable factors to maximize the value of an outcome or dependent variable. It can also be a fancy substitute for the word “improvement”, used to project the impression you are applying some kind of mathematical rigor, when in fact you are not.
This entire post may sound like nitpicking, but there is a real issue at stake.
The main difference is this:
– If you are collecting data to map out the entire feasible space of options, then picking the best solution, you are doing “optimization”.
– If you are trying two or three of something, and then picking the winner, you are doing “improvement by trial and error”.
“Optimization” leaves you with some assurance that you have left no improvement on the table. “Improvement by trial and error” may deliver value, but without a sense of whether there are further gains available.
In the realm of marketing analysis, this distinction is further tangled by the fact that there is no way to actually map out all possible creative executions, all the possible ways to deliver them to an audience (unless you believe all the good ideas have been done already, in which case you need historians and not creatives.)
So, when someone sells you creative optimization using a multivariate testing engine that automatically spits out thousands of combinations of a background image, a headline, a call to action and a button to click, you may think you are doing real optimization, but that is true only if your collection of copy bits and graphic elements represents the whole feasible range of creative executions and not just what someone could crank out in a week or so. That, IMHO, is not likely. It is really precision masquerading as accuracy or – put differently – marketers opting for the easily quantifiable to the exclusion of the extremely effective.
Not all marketing problems are best approached via formal optimization – particularly those where creative execution is a critical variable. But it is possible to apply good test design and measurement to understand when something works better than what we are currently doing and when it does not. Just don’t call that “optimization” – that is almost like lying.
I decided to take a look at the search volumes over the last 90 days for the terms “Democratic Party” and “Republican Party”.
Google Trends Chart: Republican Party vs. Democratic Party
You can clearly see the convention bounces reflected in the search volumes. For some reason, the debates don’t seem to drive that much difference in search activity.
You can see the spikes on the days of the debates (October 3, October 11, and October 16), but both parties go up about the same amount.
In recent weeks, this election looks close.
What do you think? Are you willing to leave it up to everyone else, or are you going to get out and make your choice count?
There are a large number of ways to make a hot mess out of an A/B test. Here are five:
1. Don’t Measure Conversions
“We don’t have time to set up conversion tracking. Let’s just decide based on click rate.”
This is a terrible idea. Clicking and converting are two very different things, and click rates are often not correlated with conversion rates. For example, I click on pictures of Ferraris, because I like to look at Ferraris, but you can ask all my friends – I have never bought a Ferrari. I have bought a Mazda, a Toyota, a Datsun and a Ford Maverick. You can show me a Ferrari if all you want is clicks, but show me something I might actually buy if you want conversions.
2. Don’t Do Any Test Size Calculations
Ten minutes of work could tell you that you won’t have enough data to read your test even if you ran it for two years. Are you sure you can’t afford some time to do a Google search for “A/B Test Calculator” and plug some numbers into a form?
3. Stick With Your Test Size Calculations No Matter What Happens
The test size calculations you did were based on some assumptions: confidence level, the magnitude of the difference you wanted to be able to detect, and the expected performance of the baseline or control. After you’ve run the test for a while you can begin to see where reality and your assumptions have parted ways. What should you do? Most people do repeated significance calculations and quit when they are satisfied with the significance. If you do this, you’ve spent too much time and opportunity cost on your test. You could have quit sooner, had you known about Anscombe’s Stopping Rule, which uses an approach called regret minimization, and you would actually end up with more conversions.
4. Don’t Think About Gating
What is gating?
Let’s say you have two different versions of a page: Version A and Version B. Let’s say your plan is to rotate them randomly. Let’s say your site and your content are such that most people come to the site repeatedly, say two to six times per week. If you are rotating Version A and Version B completely at random, then most of your users are going to see a blended treatment. This will reduce the effects of your test. To fix this, you want to make the version a person sees “sticky’ so one group sees only Version A during the test and the other group sees only Version B. That way each group sees a consistent treatment and you will see more of an effect (assuming the differences between A and B are substantial enough).
This is called “gating” and is done by randomly assigning new visitors (people with no gating in their cookie) to Version A or B, and then storing that in their cookie so that the next time they will see the same version.
5. Conclude That Your A/B Testing Result is Actually Optimal
An A/B test picks one “best” version for everyone. But isn’t it possible that there are some people in the audience who’d respond best to Version A and others who’d respond best to Version B? For that, you’d need to be able to collect lots of data about what kinds of users respond to the different options, and then you’d need a way to target the two versions at the audiences they work best with. Fortunately such tools exist.
Check out the toolset I work with every day at [X+1]: [X+1] Home Page
A couple of months ago, a bunch of us at [x+1] started taking a free online course in machine learning taught by Stanford University’s Andrew Ng. It was an offer difficult to refuse: a company called Coursera is offering top-flight university courses for free, and Andrew Ng’s class is among them. Thomas Friedman’s recent New York Times column offered up Dr. Ng’s experience as emblematic of a larger trend in higher education (i.e., online alternatives to an increasingly costly option for young students), but what caught my eye were the numbers.
Ng was quoted in the article:
“I normally teach 400 students,” Ng explained, but last semester he taught 100,000 in an online course on machine learning. “To reach that many students before,” he said, “I would have had to teach my normal Stanford class for 250 years.”
This blew my mind. I have been doing this kind of work for half my life, and I have never run into a group of more than 200-300 of us at one time – and that was at a SAS convention in Vegas! Now 100,000 people are taking this one course per semester!!!! I was immediately imagining a future when:
1. People at parties would understand my answer to “What do you do?” without my having to offer a hyper-simplified reduction (“statistical marketing” is the best I have come up with).
2. It will be easier to find talent in this business (good for building teams, maybe not so good for salaries).
3. A world where the business people I work with have some kind of reasonable sense of what you can and can’t do with statistics.
Realistically, these numbers need to be discounted for people dropping off because of lack of time, interest, and perhaps aptitude. However, this does point to a major trend in analytics: business people are increasingly aware that they need modern data analytics to function in the new, data-rich digital world. Given the tendency of digital entrepreneurs to flog us with buzzword-laden feather merchantry, we can also be assured of 5-10 years of “big data” blather, but I guess mimicry is the cost of increasing demand for our field.
If you are looking for a great way to visualize the way traffic is flowing through a website, try a Sankey diagram, which is a kind of flow diagram where the width of the flow arrows is shown proportionally to the flow quantity. It is a very quickly understood way of communicating what can be complex information.
Very Simple Sankey Diagram
Like many other people, I had my first taste of Sankey in Edward Tufte’s “The Visual Display of Quantitative Information”, which featured a diagram by Charles Joseph Minard that illustrated Napoleon’s disastrous march to (and from) Moscow. Arrows on the map of Europe showed the Napoleon’s route, while the width of the arrows indicated the (disastrously shrinking) size of his Army.
If you want to try this technique out on your website, read more about Google Analytics’ flow visualization here. It is a dynamic, Sankey-like diagram that you can navigate to get an intuitive visual grasp of how traffic is moving through a site.
How many times have you given a data-based presentation that made people burst into applause or made people weep? Have you ever given a talk that changed the world?
By my reckoning this has happened more than once to Hans Rosling, a professor of global health at Sweden’s Karolinska Institute. There are two TED talks by Swedish Professor Hans Rosling that stand out in my mind as outstanding examples of how statistical analysis can be:
a. Presented in a spectacularly effective way
b. Used for good in the world
In the first, referred to by many of my friends as the “Gapminder” TED talk, Dr. Rosling uses animated bubble charts to make (stunningly well) some points about worldwide trends in infant mortality, life expectancy, and distribution of wealth and productivity. The talk shows with shocking clarity how the world has been changing over time, in a form which can explode through ignorance and prejudice and create understanding. If you haven’t seen it, you should (see below).
You can use the Gapminder software to create your own animated Bubble Charts:
Gapminder Desktop download
You can also keep up with the organization that has grown up out of this effort on the Gapminder site: Gapminder.org
The second TED talk I refer to is the “Washing Machine” TED talk. This talk really showcases Rosling’s storytelling and showmanship, but is still at its heart a presentation based on data. I believe, if I could learn to present like this, there is no limit to what I could accomplish.
If you have some other nominees for Statistics Greatest Hits, please leave them in a comment.
 Latest Entry