Recent Articles
Google Trends and the 2010 Elections – Can You Use Search Data to Predict Elections?
Nov 4, 2010 Industry News, Search Analytics 48 Comments
I am interested in the use of search data to predict and forecast real-world events. One example I have mentioned here before is the Google Flu Project, which uses the volume of searches for flu-related topics to actually do early detection and tracking of flu outbreaks.
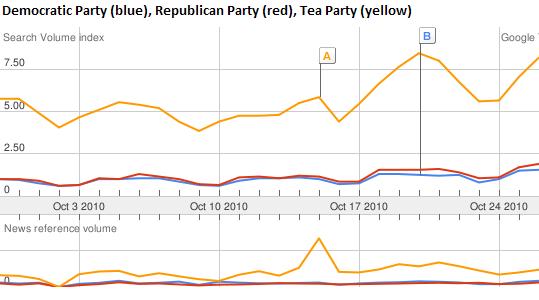
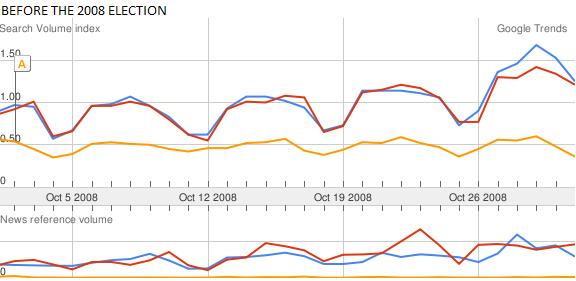
I thought it might be interesting to see whether or not there was anything I could tell about likely election outcomes from the volume of searches related to the Republican and Democratic parties. I did a comparison of the search volumes for “Republican Party”, “Democratic Party”, and “Tea Party” during October 2010, and looked at the same data for October 2008 (leading up to the last presidential election). Interestingly. the major party with the lead in October searches came out the winner in both cases. The Tea Party search volume needs to be explained though – if the voting followed the search volume completely, then we’d all be speaking Tea Party-ese now.
October 2010: More searches for “Republican Party” (the red line) than for “Democratic Party” (the blue line)
October 2008: More searches for “Democratic Party” (the blue line) than for “Republican Party” (the red line)
I KNOW, ELECTIONS ARE ACTUALLY MORE COMPLICATED THAN THAT
One glaring weakness of my half-hour exploration into election forecasting is that it is hard to imagine prospective voters searching mainly using party names. It is far more likely that candidates’ names and words relating to major issues would be the search terms of interest for predicting election outcomes. That, however, is more work than I would do for a blog post. I encourage anyone reading this to take up the gauntlet and pursue the more detailed view. Let me know how that comes out!
WHAT ABOUT THE YELLOW LINE?
Another factor that would have to be dealt with in building a real live election forecasting tool using search data would be the curiosity factor. People don’t just use search engines to research their voting interests – they also use them to satisfy their curiosity about topics (and political parties) that are currently in the public eye. That complicates the forecasting problem a bit. How can you tell idle curiosity from actual voting interest? I will have to mull that over…
Measurement is No Substitute for Thinking BIG
Oct 7, 2010 Marketing And Advertising Analytics, Statistics, Web Analytics 71 Comments
Whether you are doing SEO for a site or running paid search for one, running display ad campaigns or social media, everyone is trying to measure the same thing – they are trying to find evidence that what they are doing is worth the money and time it costs.
There is a point of view (not necessarily mine) that says: If you have to do a complicated analysis to see the effect of a marketing initiative, then it wasn’t very effective. There is some truth there. It is easier, statistically speaking, to measure a BIG marketing impact than it is to measure a small one.

Reality is complicated, though. If you are engaged in “filling the funnel”, you want to know how how that translates – in the long run – into actual sales. However, unless you can wait until there is data for the whole decision and purchase process to make any decisions about how to manage the campaign and the channel, then you will have to go with measuring some intermediate impact.
It is almost a certainty that enough other things will happen to impact sales in the time between your funnel-filling campaign and the sales it ultimately leads to. Enough things to muddy the waters about how much of of your success (or lack of it) came from the lagged effect of your funnel-filling efforts. Unless the effect is big.
This is not to say that measurement is not necessary for early-stage marketing activities, but to say that you have to apply some common sense to your measurement problems, and one bit of marketing common sense is this: think BIG. Now think BIGGER. You should always be aiming to have a big effect – you won’t always succeed in a huge way, but it should not be for lack of trying.
Here’s an idea: Every time you create a campaign, a marketing tactic, an ad, you should at least TRY to do some creative thinking that taps into one or more sources of disproportionate (on the BIG side) response. What well-defined and targetable group would have a peculiar affiinity with your message and your product? What would make them want to know more NOW, click NOW, buy NOW?
What does that have to do with measurement? Two things:
1. Even if your BIG idea doesn’t work, you are actually testing a hypoethesis and so you have gotten just a little smarter.
2. Your goal is to produce impact so BIG that you don’t even really need to measure it to know that the effort was ROI-positive. (But you are measuring it anyway, so you can explain why the next one needs to have a bigger budget!) And – falling short of a really BIG goal will get you to positive business results more often than falling short of modest goals.
The “Death of Marketing” Has Been Announced Prematurely
Aug 23, 2010 Industry News, Marketing And Advertising Analytics, Social Media, Web Analytics 32 Comments
Has there been a fundamental change in how people think about and buy goods and services? Is old-school marketing dead?
According to the recently-minted orthodoxy of social media, marketing is being transformed, and we are moving from the Age of Push to the Era of the Conversation. The Don Drapers of the world, they say, will now have to play the new way, find new jobs or become hobos. Participation in a conversation is voluntary, per the new theory, meaning marketers can’t unilaterally control conversations and so now must learn to communicate differently with the people in the marketplace.
WHAT HASN’T CHANGED
Marketing Has Always Been A Conversation – Marketers Just Haven’t Recognized It Until Now
There is an important truth here – much of the conversation about brands and products is intra-customer, and doesn’t involve the marketer at all. This has always been the case, but it just has not been as observable until it started happening online.
Audiences Have Always Been Able to Walk Away
Audiences have always asserted more control over the “conversation” than marketing models have admitted. People have been fast-forwarding and channel-surfing through television ads since they figured out which remote control buttons to use. Since the very birth of mass media, admen and their clients have been solving and re-solving the problem of how to entice an audience to listen to their stories instead of wandering off to grab something from the refrigerator.
Propaganda Still Works
Working against this is has always been the fact that (as psychological experiments have shown) repeated messages have an influence on peoples’ perceptions and behavior even if they are skeptical or not paying full attention, and even if they are aware they are being ‘sold’.
WHAT HAS CHANGED
The Emergence of Social Media
Thanks to social media lowering the bar for what constitutes a relationship, people are regularly engaging in communication with a wider circle of casual or low-involvement contacts.
Conversations are Observable and Trackable
We can find out what people are saying about brands and our products (at least when they happen in online social media). These conversations can assert a great deal of influence on buying behavior.
Advertisers and Marketers can Participate in the Conversation
Marketers can, when they decide it is to their advantage, participate in these conversations and assert some influence on the the agenda and the messages
Advertisers and Marketers can START the Conversation
Marketers can initiate conversations, and they can provide the platform or venue for these conversations to take place. However, the the attempt can backfire. Conversations can and will change locations if a community gets the sense that there is excessive censoring or propagandizing.
SO?
So, things have changed, but not that much. People still need to buy things, they still need to decide what to buy and where to buy it. It’s just that now, people increasingly use social media (among other channels) to get information about products and services they are considering. Social networks have always been influential, but now they are pervasive, instantaneous, and measureable. So you shouldn’t ignore social media, you should listen to and participate in it. That’s all.
The Digital Nervous System
Aug 20, 2010 Industry News, Marketing And Advertising Analytics, Statistics, Web Analytics 70 Comments
The web can function like a giant extension of the human nervous system. Like a spider at the center of a giant global web, you can collect and observe streams of data coming from all over the digital expanse: searches, tweets, forums, blogs, newspaper and magazine sites, press releases, Facebook and LinkedIn. Each time someone looks for or mentions your company or your product you are alerted, and you can choose in that moment to respond to it, ignore it or wait until you have more information.
Does this sound like anything you are doing now? Someone should be doing this for your company, because marketing has increasingly become an ongoing series of conversations (whether you participate in the conversation or not).
EXPERIMENT: DETECTING INSTANT RESPONSE TO MEDIA WITH THE INTERNET
There are several national TV shows that frequently have book authors as guests (the Daily Show, The Colbert Report, The Today Show, Good Morning America). The next time you find yourself in front of one of these shows when an author is on plugging their book, try the following experiment (this will work best with a show with a national audience):
1. Fire up your laptop and go to amazon.com
2. Search in the Books category for the title of the book the author is plugging on the show you are watching
3. Click to the Amazon page for that book.
4. Scroll down past the synopsis and the reviews to the section labelled Product Details. It should look something like this:

The number I have circled is the book’s current sales rank on Amazon.
5. Every few minutes while the author is on the show and for a while after that (until you bore of this experiment), hit function key f5 to refresh the page and watch what happens to the book’s sales ranking.
The rank should get better – in real time – as you are sitting there. I have done this several times when my brother-in-law has done TV appearances to promote his books, and it is amazing. Once he was on Oprah Winfrey and we saw the sales rank improve precipitously from 20-something into the top 10 while he was being interviewed.
Now imagine all the other analogous information streams there are available on the internet. If you could get the monitoring automated, just think of how quickly you will know exactly what the world thinks of your new site, your new ad campaign, your new product. Just think of what you’d be missing by NOT knowing.
EXTRA CREDIT EXPERIMENT #1 – THE TWITTER BUMP
In between rank checks you should do check in on Twitter searches for the author’s name and the book’s name. These should also pop during the author’s TV appearance.
EXTRA CREDIT EXPERIMENT #2 – THE GOOGLE BUMP
After a day or so you should go to Google Trends and see what happened to searches for the author’s name and the book’s name. These should’ve spiked on the day the author did the TV appearance. Google Trends doesn’t provide much flexibility about getting more granular (in time) data in a more real-time way, and it looks like the beta for Google Insights for Search has a latency of a couple of days.
GOOGLE EPIDEMIOLOGY – WHO KNEW THEY COULD DO THAT?
Take a look at the Google Flutrends project (http://www.google.org/flutrends) and you can see what an amazingly useful datasource this would be with access to the full detail in realtime. It turns out that counting Google searches for flu information is a quicker detector of flu epidemics than CDC reports are.
I believe it would be just as accurate in detecting other kinds of contagion sweeping through the world: fads, emerging trends, scares, rumors, accidents, disasters – this is the kind of information that businesses need to know when it involves their products, their brands, or their markets.
Classic GI=GO Equation Holds True for Web Analytics
Aug 20, 2010 Statistics, Web Analytics 141 Comments
Garbage In = Garbage Out. People who spend their working hours analyzing numbers generally come to this realization. It is true for modeling, it is true for forecasting, and it is completely true when it comes to website analytics.

The chain of events looks something like this:
1. Someone visits a website integrated with a web analytics platform like Google Analytics, Webtrends or Omniture.
2. A web page visitor either navigates to a tracked page or performs a tracked action.
3. A script is executed in the browser, sending data to the analytics platform.
4. The data is added to the datastore.
5. The data is summarized and analyzed.
Problems arise when you assume that steps 1 through 4 are happening correctly, and you move right on to looking at reports and data that come out of the process. Oddly, most site developers I have met who are instrumenting a site for web analytics consider their job done and successful if tags fire when they are expected to. They don’t look at the data as it is passed with the tags and they don’t look and see what made it into the web analytics platform’s datastore. Anything you don’t check in software development is frequently going to be wrong. If your data is wrong, then all your analysis of it will be just as wrong as the data. Again, there’s the classic equation describing this relationship:
Garbage In = Garbage Out
How do you prevent your data from being garbage? QA and debug the data, that’s how.
Before you use information coming from a web analytics solution, you should (or someone should) do these two tests:
1. Web Analytics Data Test Number One: Is the data being passed correctly?
Use a header tool of some kind to see what tags are being invoked and what kind of data they are passing to the web analytics platform. I use WASP. It shows you what kind of tag is fired when you click on navigation and site functions, and then it lists the data values the tag passes. The test is this:
Step 1: Navigate to every page in the site. A pageview should be generated for every pageview you generate and it should have the correct page name passed with it. Implementation of this is usually OK for standard HTML sites, but is error-prone for Flash sites.
Step 2: Click every function you are tracking as an action or event. See that an action or event is generated for each one you click, and that it is firing a tag that classifies it correctly – as an event, not a page view, and that the name and category that are assigned to the action are what they should be.
(Steps 3-n): Anything else you have tagged for measurement, like ad placements for an ad server, should also be clicked systematically to see that everything that is supposed to be captured about ad impressions is actually captured and passed when the tag is fired.
2. Web Analytics Data Test Number Two: Is the data making it into the database(s) correctly?
Set up your full site in staging so it will have a recognizable hostname that you can filter by in your reporting tool. Tell everyone else not to play with the version in staging for a while.
Step 1: Navigate to every page in the site in a systematic order. Do this several times. Make sure you keep track of how many times each page is viewed.
Step 2: Click every function you are tracking as an action or event. Do this several times. Make sure you keep track of how many times each action is done.
(Steps 3a-3n): Anything else you have tagged for measurement, like ad placements for an ad server, should also be clicked systematically – count the impressions and count the clicks.
Step 4: Click through every funnel you have set up, several times, all the way to the goal. If you have goals like time on site or number of pages viewed, make sure you stay long enough and look at enough pages to meet these goals.
If there are required pages in your funnels, make sure you pass through them. Again keep updating the tallies of page views and actions as you do all this.
Step 5: Wait until the data is likely to be available for reporting. Latency varies by platform. Pull reports, filtering for your hostname. You should see that the numbers of page views, actions, ad impressions, ad clicks, goals/conversions, and funnel stages matches what you did in steps 1-3. If they do not, you probably either have:
a. a tagging problem (wrong tag, misimplemented tag, redundant tags, etc.)
b. a setup problem (e.g. definitions for goals/conversions, funnels)
c. other users muddying up your data by hitting the site in staging while you are testing.
d. a more exotic and difficult problem
If this all sounds like a pain in the hindquarters, compare it to the pain of realizing that you have been reporting erroneous numbers and making business decisions based on them for months or years. Believe me, they could be so far off that you’d have been better off guessing or making numbers up. Do not trust what you cannot verify with test results, or you will have much pain and sadness in your future.
Digital Marketers Should Not Act As If TV Doesn’t Exist (There’s An Elephant in the Room)
May 26, 2010 Industry News 6 Comments
A lot of digital media analysis is very compartmentalized, meaning that the effectiveness of social media focuses exclusively on direct measures of social media and measures of desired outcomes. I think this is very risky. By not including causal variables like spending in adjacent marketing channels (in this case search, email, and display) or nearly ubiquitous channels (TV), you run the risk of confusing the effects of your efforts with the impact of exogenous factors you do not control.
Let’s say you are analyzing the digital marketing efforts for a client that invests heavily in websites, display advertising, paid search, SEO, email, and social media. Let’s say they are also big spenders in traditional media, like TV for instance. Analyzing the effectiveness of your online efforts without have some measure of tv spending or exposure in your mix of causal variables is a bit like trying to say never mind the sun, your flashlight caused the day to begin. That’s an exaggeration, but take a look at the average weekly usage numbers from the Q4 2009 edition of the Nielsen Three-Screen Report (http://en-us.nielsen.com/main/insights/nielsen_a2m2_three):

People watch their TVs nearly nine times longer per week than they use the internet. Also, TVs reach more households than the internet. I’m not saying every analysis needs to be a marketing mix analysis, but you don’t want to do a sailing analysis without looking at wind as a causal variable. If I think of any more dumb metaphors, I’ll add them as comments.
Evidence-Based Marketing Experiencing A Wave of Growth?
Apr 27, 2010 Industry News 18 Comments
While news stories abound about the gradual and imperceptible movement of the U.S. economy toward recovery, it is apparent to me that there is one niche which is taking off ahead of the general recovery: services related to evidence-based marketing.

What is evidence-based marketing? It is an approach to marketing that attempts to make marketing decisions and manage marketing activities – as much as possible – based on evidence: measurements, information, facts, data. This is being fueled, I think, by two factors:
1. The data-rich experience that advertisers have had as they have immersed themselves in the world of digital marketing
2. The tremendous pressure that a down economy has placed on marketers to provide evidence that the money they spend is well-spent
As an evidence-based marketer myself, I would not have arrived at this conclusion without… well, evidence. As someone who does independent consulting between “real jobs”, I try to stay close to the job market for marketing analysts and digital marketers, in what I would call a perpetual passive job search. The number of hiring inquiries I have gotten from recruiters in the past three weeks has been amazing and is significantly greater than I observed earlier in the year – 3 to 5 contacts per week (versus 3 to 5 per month in January).
Let’s hope this leading indicator is followed by some serious actual growth!
Some other interesting facts:
– I took a look at the Google Trends data for the keyphrase “marketing analytics” and it showed a strong uptick between the end of 2009 and the beginning of 2010. This came substantially ahead of my anecdotal increased job inquiries, but maybe it is a leading indicator. It would seem that prospective clients might research vendors and taxonomy within the field prior to actually meeting with agencies about it, and I would imagine that, as people began planning their hiring for the year and contacting recruiters, there were more searches for this phrase because recruiters want to understand the fields they are hiring for so they can market them effectively.
– Prior to this year, I have only once ever been contacted about a job at an ad agency. This was in 2005, and the agency was one known for direct marketing. Otherwise, almost all the jobs people have reached out to me about prior to this year were with either companies doing a lot of online marketing, marketing services firms, consultancies, or firms selling marketing data and market research. In the last two months, however, I have been contacted about more than eight positions with ad agencies. Most have been digital agencies, but I have had two interviews with full-service agencies known for their creative. Neither resulted in a job, but I went more out of curiosity than out of a realistic sense that they would know how to integrate someone like me into their organizations. In any case, it seemed like it would be fun to try to bring ideas from the world of analytics and measurement into a strongly creative-centric group. Who knows, maybe I’ll get another chance.
Anyway, I would love to know if any other marketing analytics practitioners out there have been experiencing anything similar. Leave a comment. Let’s discuss.
Listing Your Way to the Finish Line
Mar 25, 2010 Statistics, TV and iTV Analytics, Web Analytics 7 Comments
Draft Marketing Analysis Checklist
After reading Atul Gawande’s recent book “Checklist Manifesto”, I was thinking there should be a checklist for marketing analysis. One point that Mr. Gawande makes in his book is that highly-trained specialists shun checklists because in their minds only dummies need lists. However, a majority of surgeons, while rejecting lists for their own use, would want another surgeon to use one if operating on them. This is because they know how easy it is to forget one detail in hundreds.

In marketing analysis, there are a lot of steps and a lot of things to think about, and even a smart person might drop a stitch here or there if they are not following some kind of list. I have included a rough one I dashed off quickly, in hopes that others might offer refinements, altogether better lists, or more specific versions for types of marketing programs. Here it is, have at it!
DEFINE
• SET goals/ hypotheses for program
• SELECT metrics
• CREATE a measurement plan
EXECUTE
• EXECUTE program and measurement plan
• VALIDATE raw data
• PREPARE dataset for analysis
ANALYZE
• VISUALLY EXPLORE dataset for patterns and problems
• SUMMARIZE dataset statistics
• SCORE performance vs. goals/ support for hypotheses
• LIST likely conclusions
• IDENTIFY unexpected or surprising findings
• VALIDATE likely conclusions with numerical/statistical support
• SELECT final findings
COMMUNICATE
• REPORT findings for future activity
• REVIEW findings with user community
• CAPTURE questions &issues from user community
FOLLOW-UP
• INVESTIGATE user-identified questions & issues
• IDENTIFY impact on original findings
• REPORT findings of follow-up analysis
What do you think?
Conversion Optimization: It’s All About Action
Mar 21, 2010 Optimization, Statistics, Web Analytics 5 Comments
Optimizing your website to maximize the number of page views or visitors, while sounding reasonable, may unwittingly have you wasting marketing dollars and effort on people who won’t buy anything or participate on your website (or your advertisers’ websites) in the foreseeable future.

When you spend time and money on your site content or on audience development for your site, you want to make sure you are measuring the impact of those changes in terms of number of desired actions taken by visitors to your site, in terms of the efficiency with which you are spending resource. The key measure you are tracking on the cost side is the ECPA, or effective cost per action. If you have a small site and are passive about audience development, perhaps it makes sense to optimize to Actions Per Visit (APV), or Actions Per Daily Unique visitor (APDU). But if you are spending serious time and money then you need to track these costs and what they generate.
Lights! Camera! Actions!
Before this kind of thing makes any sense at all you have to define and start measuring the on the kinds of action you are trying to get visitors to take. Are you selling things? Are you getting paid for advertising shown on your site? Are you trying to develop leads for your business? Are you trying to get people to download something? Are you trying to get people to register or sign up? Whatever actions you want people to take on your site, they need to be measured if they are going to be the basis for your ECPA (or APV, APDU). Most of these things can be measured using Google Analytics.
In any case, once you have tagged or otherwise instrumented your site to capture your desired actions, then you can track ECPA (or APV, APDU) associated with your site.
Then when you make big changes, you can see whether they improved your site’s performance. You can measure the effectiveness of your SEM, your CPC campaigns on search engines, your affiliate programs, and your efforts to publicize your site.
Measuring Dollars Out per Dollar In
ECPA is a pretty good measure, but, it only measures efficiency on the cost side. You also want to measure the return you get in dollars and cents. You can do this (or approximate this) if you can come up with a dollar value for each of your site’s target actions, either using an average value per action type or actual value per action, then you don’t need the oversimplification that focusing only on ECPA imposes. Simply put, all actions on your site are not worth the same amount and it actually makes sense to spend more on actions that are worth more. What you really ultimately want is an ROI. I’ll talk about that in a later post.
Math Marketing: Excellent White Paper by Dimitri Maex
Mar 15, 2010 Industry News, Marketing And Advertising Analytics, Optimization, Statistics, Web Analytics 11 Comments
Dimitri Maex is the Managing Director Marketing Effectiveness at Ogilvy & Mather, and the author of a fantastic white paper that is posted HERE on the WPP website . What is so great about it is that it presents exactly what most companies need to know in order to get started in harnessing the full power of quantitative marketing methods, in a package that only takes about 15 minutes to read.

He starts with the history of quantitative marketing, gives a sense of the place of “math marketing” in the current business landscape, describes the types vendors with which a company can ally, and the wraps up with how a company should organize and hire to around the new skills and challenges peculiar to the coming era of quantitatively-driven marketing.
Some nits:
I don’t like the sound of the name “math marketing”. It’s just that the math doesn’t do any marketing – people still make the decisions and integrate the insights into their work, they just use data-based metrics and statistical techniques to assist them in getting a coherent picture of what is working and what isn’t, and formulating what might work in the future. It is probably also a terrible way to brand something you are selling to execs who mostly sucked at and avoided math in school. It’s like calling it “eat your vegetables marketing”.
The section on vendors is far from exhaustive. He leaves out SEM/SEO agencies in particular, and provides only the massive brand names in most of the categories he is describing. I guess Maex works for an ad agency – so he’s not responsible for selling you on his competition – but I’d look elsewhere for a buyer’s guide.
Whatever, he is right on the money about the current state of affairs and where most companies need to go.
He wraps with a couple of lists: Seven Steps to Increased Accountability, and Seven Steps to Increased Accountability to Transformational Consumer Insights.
This is a great document for business folk who want to understand the big picture of marketing analytics and quantitative marketing techniques, and want to understand how to manage them to best effect.